Key Takeaways For Farm Operators
- Electricity is the largest controllable operating cost in RAS and land-based farms, spread unevenly across pumping, temperature control, aeration, and filtration.
- Published RAS energy intensity ranges from 3.5–30+ kWh/kg, driven by species, climate, system scale, recirculation rate, and measurement boundaries.
- Temperature control and pumping are mostly set by biology, geography, and hydraulics, while aeration and oxygenation offer the clearest opportunity for meaningful energy reduction.
- Peer-reviewed research shows nanobubble oxygen delivery can reach much higher oxygen transfer efficiency than conventional aeration and hold dissolved oxygen for days.
- Aquadei provides a nanobubble platform specifically engineered to cut electricity use on the aeration and oxygenation line while maintaining dissolved oxygen targets.
Discuss An Energy-Focused Nanobubble Plan
The Problem: Why kWh per kg Varies So Widely
Published energy intensity figures for recirculating aquaculture systems span a wide range. A 2026 systematic review by Brazauskas and Povilaitis of Vytautas Magnus University, published in Water, reports an average of 29,400 kWh per tonne of fish for a pilot-scale cod RAS, varying seasonally between 18,400 and 40,600 kWh per tonne. A commercial salmon RAS in the same review reported 7,509 kWh per tonne. The authors are explicit that these values are not interchangeable. A 2026 study by Buoio and colleagues at the Università degli Studi di Milano, published in Sustainability, cites a typical RAS electricity consumption range of 15 to 30 kWh per kilogram of fish produced. FishMatch Group’s 100-tonne-per-year RAS reference architecture specifies 3.5 to 5.5 kWh per kg for a well-designed commercial facility. Read together, these figures look contradictory, yet they describe the same metric measured over different boundaries and contexts.
The spread comes from identifiable drivers. Species and optimal growth temperature, climate and latitude, system scale, recirculation level and water exchange rate, and whether the figure is measured at the meter or modelled all shift the result. A 2026 systematic review by Klatt and colleagues, covered by Vetofish veterinarians Emmanuel Leguay and Emmanuel Meunier, retained 22 quantitative studies and found that differing system boundaries and denominators restricted direct comparison. Some studies counted only main-loop pumps. Others included oxygenation, heating, UV treatment, ozone, lighting, feed production, buildings, and effluent treatment.
The most useful distinction for operators is the difference between on-site electricity intensity and cumulative energy demand. On-site electricity intensity, expressed in kWh per kilogram of fish produced, measures what the facility meter records. Cumulative energy demand, expressed in MJ per tonne and used in life-cycle assessments, adds the embodied energy in feed manufacture, ingredient processing, and transport, which never appears on a farm’s electricity bill. Hornborg and colleagues, writing in Reviews in Aquaculture (2026), explain that metered electricity intensity can be numerically much lower than, or otherwise differ from, cumulative energy demand because the two metrics use different system boundaries. Feed production alone, per Buoio et al. (2026), accounts for over half of aquaculture’s total indirect greenhouse gas emissions. Each number answers a different question, so operators should treat them as complementary rather than comparable.
System Types And Where Their Energy Goes
The four principal aquaculture system types differ in on-site electricity intensity and in which load dominates the bill. As the table shows, the dominant load shifts from temperature control and pumping in RAS to aeration in ponds to vessel fuel in open-water farms, so the highest-impact intervention changes with system type.
| System Type | Relative Energy Intensity (On-Site) | Dominant Electricity Load | Main Driver of That Load |
|---|---|---|---|
| Recirculating aquaculture system (RAS) | Highest, typically 3.5–30+ kWh/kg depending on species, climate, and scale | Temperature control or pumping, depending on species-climate mismatch | Continuous recirculation, water treatment, and thermal management |
| Flow-through system (FTS) | Moderate, pumping-dominated where head is significant | Water pumping and distribution | Volume of water moved and hydraulic head |
| Pond (intensive/aerated) | Lower than RAS, aeration-dominated | Aeration | Dissolved oxygen maintenance across large water volumes |
| Coastal/open-water (cages, shellfish) | Lowest direct electricity, fuel-dominated | Vessel fuel and live-feed production | Marine operations and logistics rather than on-site power |
Coastal and open-water farms have much lower direct electricity demand. A July 2026 JBT Marel analysis of land-based salmonid farming notes that coastal farms’ direct energy use is dominated by fuel consumption for boats rather than on-site electricity. Cradle-to-gate studies show coastal farms have significantly lower energy use than RAS, although the comparison still depends on system boundaries and energy sources. Across all fed systems, cumulative energy use is dominated by feed production and logistics rather than on-site power.
What Consumes The Most Electricity In A RAS?
Within a RAS, electricity falls into four major categories. Their shares shift with climate, species, and recirculation intensity, so the percentages from any study must be read against that study’s system boundary.
- Temperature control: In cold-climate operations or warm-water-species facilities, heating and cooling can exceed half of total facility electricity demand. Brazauskas and Povilaitis (Water, 2026) identify the heat pump as one of the largest electricity consumers in a pilot-scale cod RAS. An Ocean Economist analysis (August 2026) reports that in some RAS facilities temperature control accounts for more than half of electricity demand.
- Pumping and circulation: The Ocean Economist analysis reports that water circulation alone can account for nearly half of electricity demand in some facilities. FishMatch Group’s RAS design guide identifies pumping head as a primary energy driver, because every additional metre of head adds to the load. Kabir and colleagues at Zhejiang University (Water, 2026) report that optimized octagonal tank geometries have achieved up to 65% reduction in pumping energy.
- Aeration and oxygenation: This load varies with biomass, feeding rate, and temperature. FishMatch Group estimates RAS oxygen demand at 0.4–0.6 kg of oxygen per kg of feed, which makes the choice of delivery method a lifetime cost decision. Kabir et al. (Water, 2026) report that AIoT-based smart aerators achieved a 26.3% reduction in energy use compared with manual aeration control.
- Filtration and disinfection: Mechanical drum filters, biofilters, UV lamps, and ozone systems each carry a continuous electrical load. Owatari and colleagues at the Federal University of Santa Catarina (Fishes, 2026) note that RAS oxygenation must satisfy both fish respiration and the oxygen demand of nitrifying biofilters, which makes gas exchange a coupled, energy-intensive function.
Temperature Control: The Often Hidden Dominant Load
Temperature control often dominates RAS energy use once operators move beyond temperate-climate trials. Many academic studies run in climates where ambient water sits close to the species’ thermal optimum, so heating and cooling appear modest on paper. Real facility bills tell a different story.
The gap between a species’ optimal growth temperature and the temperature of available source water must be closed by heat exchangers, chillers, or heat pumps. This equipment runs continuously and draws heavily. For cold-water species such as Atlantic salmon or cod raised in warm-climate facilities, or warm-water species such as tilapia raised in northern Europe, the thermal load can exceed every other line item.
Insulation, building envelope design, and heat recovery from process water can reduce this load materially. Biology and geography still set the floor. FishMatch Group’s RAS design guide notes that warm-water species require heating in cold climates and cold-water species require chilling in warm climates, and the energy bill follows this species-climate mismatch. Because temperature control is mostly fixed by those factors, the highest-return interventions sit elsewhere.
The Solution: Aeration And Oxygenation As The Main Lever
Dissolved oxygen is the binding biological constraint on stocking density and growth rate, and every RAS must meet that requirement. The practical goal is to deliver the required oxygen with less electricity while holding safe dissolved oxygen levels throughout the system. That is the engineering problem on the aeration and oxygenation line.
Peer-reviewed research from the University of Florida’s Indian River Research and Education Center, with a co-author at the USDA Agricultural Research Service, published in the Journal of Environmental Engineering (Vol. 150, No. 5, 2024, article 04024018), tested a Gaia Water UFB 100 ultrafine bubble generator on stormwater, groundwater, and agricultural drainage water. The study reported oxygen transfer rates up to four times greater than conventional aeration, with dissolved oxygen holding for 6 to 15 days before water returned to pre-injection levels. The authors present the technology as a way to mitigate hypoxia and anoxia without the continuous energy draw that conventional aeration requires. Scope matters here. The trials used 100-litre greenhouse tanks with field-collected samples, and the authors caution that maximum supersaturation is not the operational goal, suggesting approximately 10 mg/L as a more sustainable target.
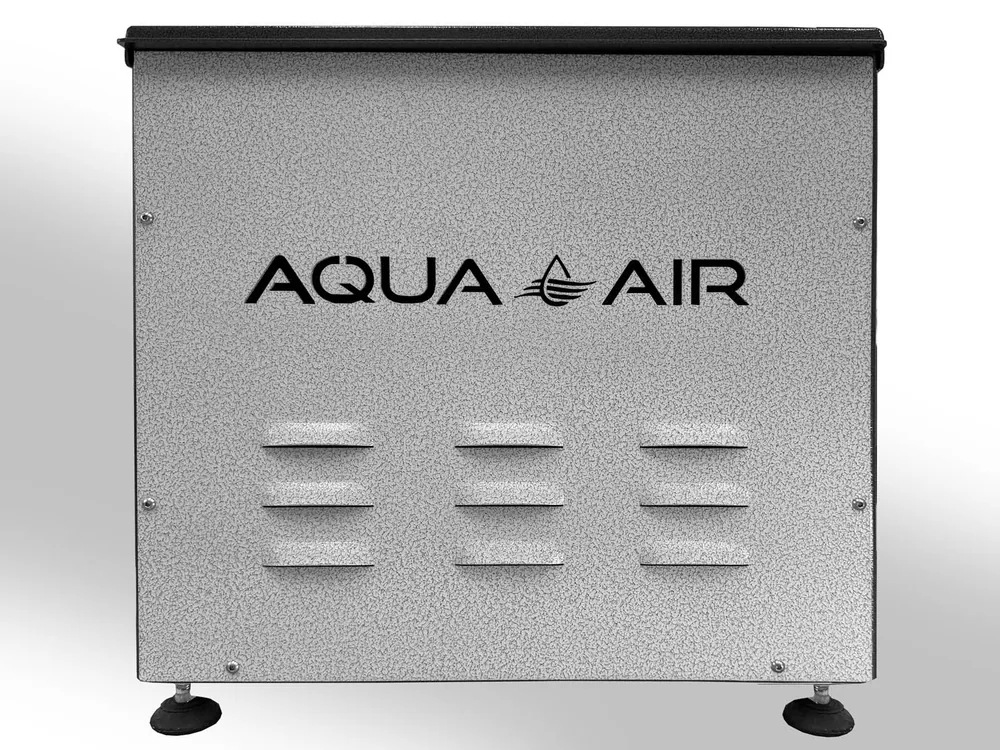
That caveat guides equipment selection. Operators need generators that reliably reach a practical dissolved-oxygen target without overshooting. Aquadei’s nanobubble platform is built for that operating window and for reducing electricity use on the aeration and oxygenation line. Aquadei works with more than 15 universities and government labs, has independent laboratory confirmation of its bubble production at the University of Osaka’s photonics laboratory, appears in peer-reviewed studies where independent researchers used its generators, and maintains in-house characterisation capability in a PhD-operated laboratory.
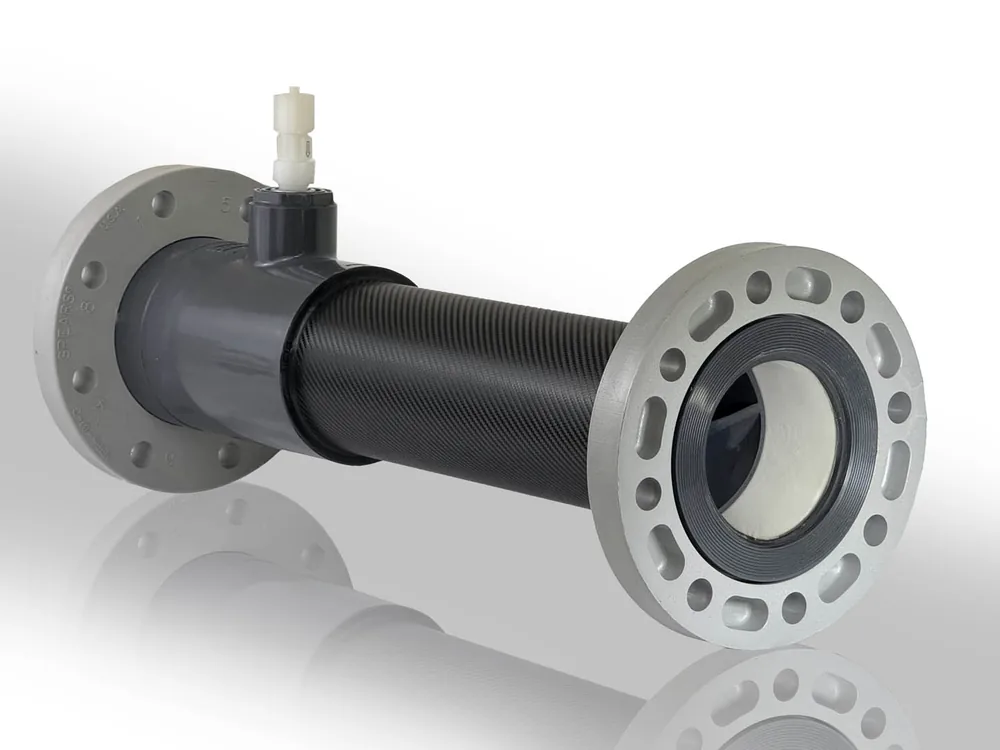
The Aquadei UFB generator produces nanobubbles at 100 nanometers or below and is engineered to the ISO fine bubble framework (ISO/TC 281, ISO 20480-1:2017). It has no mechanical moving parts in the flow path. Nanobubbles at that scale typically carry a negative surface charge, although surface charge can shift with water chemistry, as shown by the ASU/Penn State study that measured ζ-potential moving from −25 mV in ultra-pure water to +30 mV in real freshwater. Nanobubbles move through the water column by Brownian motion rather than rising and off-gassing, and they remain stable for weeks to months. They act as distributed reservoirs of dissolved oxygen, so oxygen is delivered and held at depth and the aeration line draws less power for the same or better oxygen delivery.
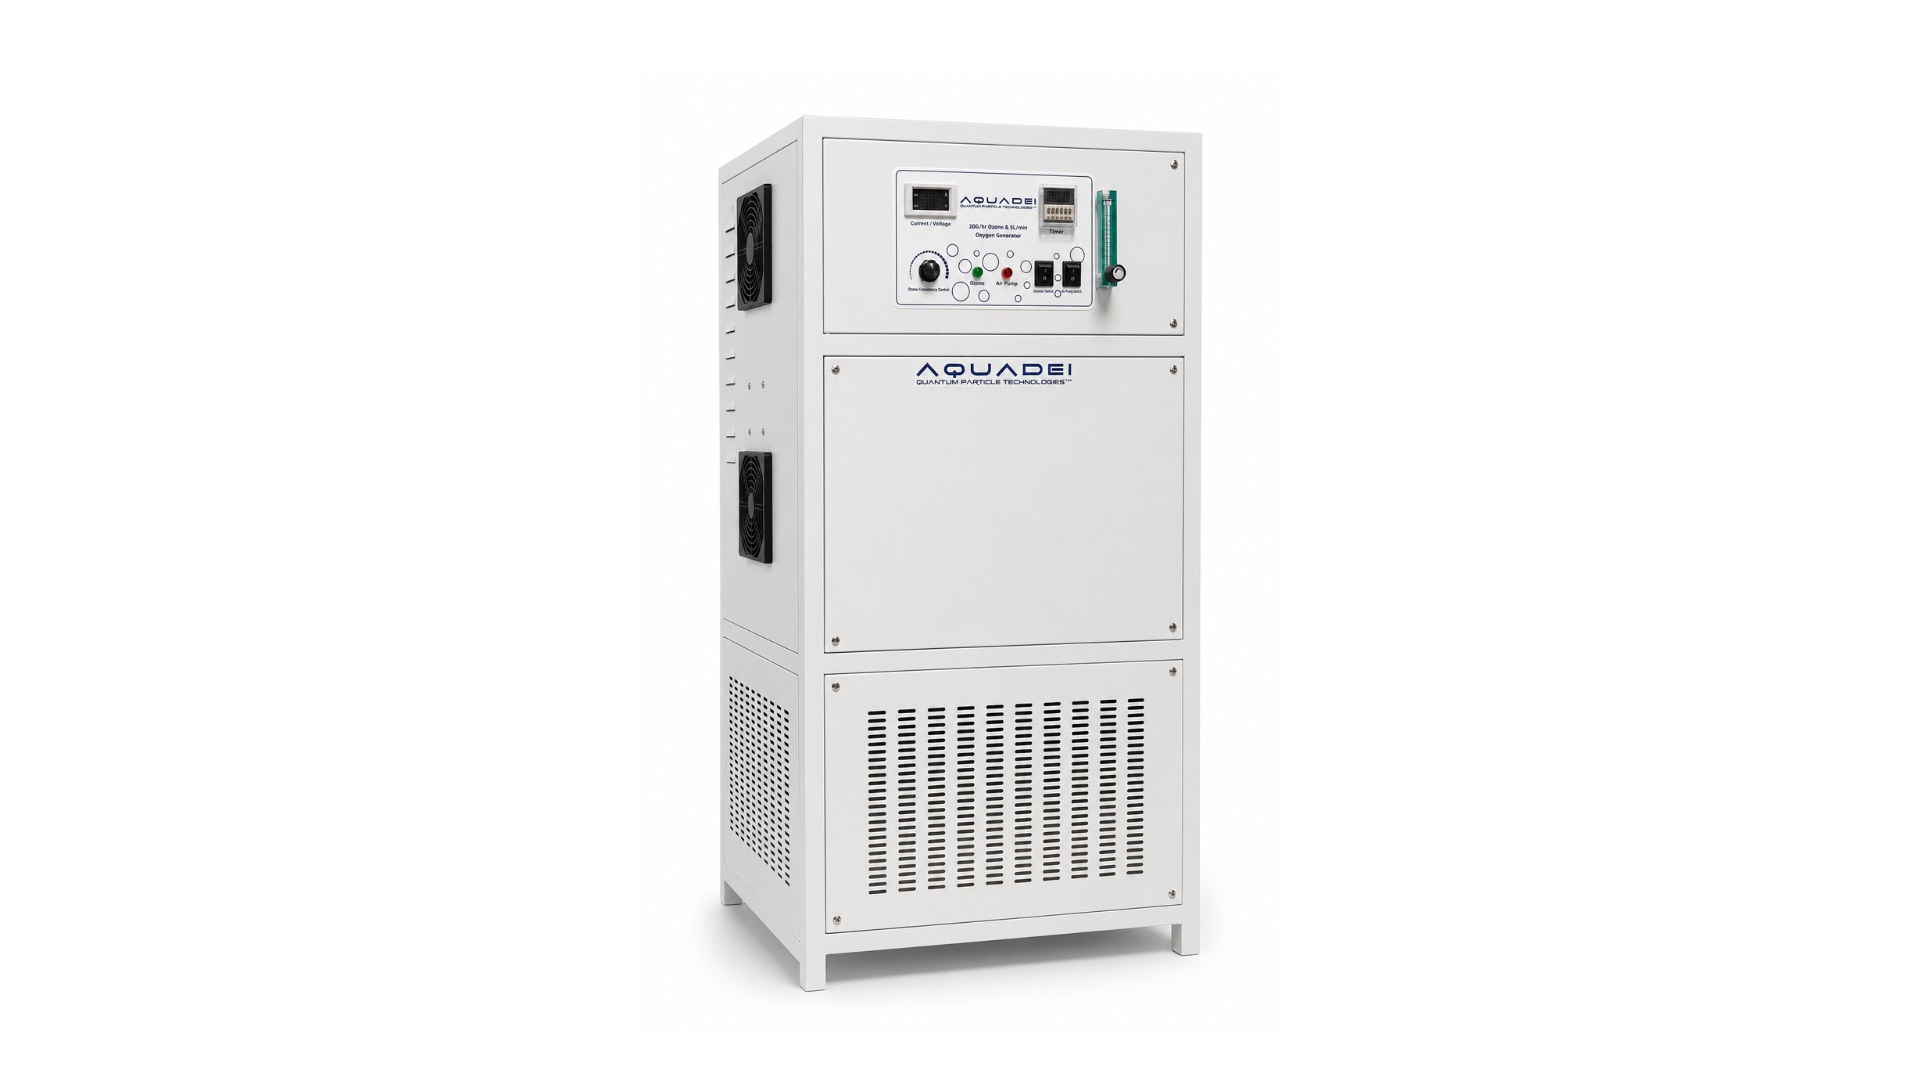
The same platform supports seafloor remediation duty in aquaculture, where oxygen is delivered directly to the sediment layer to address uneaten feed and organic waste beneath pens. This requirement is now regulatory in some jurisdictions. Six Aquadei ultra-fine bubble mixers were supplied to the Macquarie Harbour Oxygenation Project in Tasmania, a joint initiative of the Australian Government’s Fisheries Research and Development Corporation and Salmon Tasmania, run to support conservation of the endangered Maugean skate. The trial scaled oxygen delivery to roughly 3,000 kg per day, with an oxygen plume documented at approximately 800 metres long and 5–10 metres thick. Scientific findings from that project belong to the Institute for Marine and Antarctic Studies and its partners, while Aquadei’s role was supplying the ultra-fine bubble mixers.
For operators considering ozone nanobubbles in saline or marine aquaculture contexts, peer-reviewed research led from Arizona State University with co-authors at Penn State, published in Water Research (Vol. 295, 2026), found that ozone nanobubble treatment in bromide-bearing water produced bromate, a regulated disinfection by-product. Any ozone-based nanobubble application in marine or brackish aquaculture therefore requires deliberate operational controls and careful monitoring.
For more on dissolved oxygen targets and protocols in aquaculture, see Aquaculture Dissolved Oxygen Levels: Targets and Protocol.
Size A Nanobubble System For Your Farm
How To Reduce Aquaculture Energy Use, Ranked By Impact
Operators can rank interventions by the combination of load size and controllability, then work down the list.
- High-efficiency oxygen delivery on the aeration and oxygenation line. This intervention sits first because the load is large and continuous, and dissolved oxygen targets can be met with less electricity through better transfer efficiency. Nanobubble oxygen delivery, as the University of Florida and USDA-ARS trials showed, achieves far higher oxygen transfer efficiency than conventional aeration and holds dissolved oxygen for days rather than hours. A 2026 simulation study published in Sustainable Energy Technologies and Assessments found that demand-responsive aerator control reduced modelled electricity use by 17.8 percent and CO2 emissions by 31.9 percent compared with continuous aeration, while maintaining safe dissolved oxygen levels.
- Heat recovery and envelope measures on the temperature line. Insulation, heat exchangers on recirculating water, and building envelope upgrades reduce the thermal load that heat pumps and chillers must close. Biology and geography still set the floor, yet the gap between that floor and current consumption is often large in older or poorly insulated facilities.
- Variable frequency drives and right-sized pumps on the pumping line. Pumping power scales with flow, head, and efficiency. Oversized pumps running at partial load, clogged filters raising head loss, and undersized pipe increasing friction all inflate the pumping line without improving useful flow. Variable frequency drives allow pump speed to track actual demand rather than running at nameplate capacity continuously.
- Renewable integration and load shifting. Solar and wind generation can offset a meaningful share of RAS electricity demand. The 2026 simulation study from Saitama University demonstrated that coordinating aerator operation with on-site solar and wind generation, battery storage, and grid power reduced modelled electricity use by 17.8 percent. Renewable integration must always respect the hourly life-support load, because aeration and oxygen supply cannot be interrupted without risking fish mortality.
For a broader view of nanobubble system evidence in aquaculture, see Aquaculture Nanobubble Systems: An Evidence-Graded Guide.
Building Your Own Energy Estimate
Energy estimation becomes more useful when it reflects your own facility rather than a generic benchmark. Start by multiplying annual production in kilograms by the energy intensity in kWh per kg that best matches your system type, species, and climate, using the published ranges above as the starting bracket. Then multiply the resulting annual kWh figure by your local electricity tariff to arrive at an annual electricity cost for that load.
Where sub-meters are available on pumping, temperature control, oxygenation, and filtration, use measured load figures instead of published averages. Measured data will always describe your facility better than a benchmark drawn from a different system with different boundaries. Sanity-check the result against published ranges for your system type, and flag any load that sits materially above the range as a candidate for investigation.
Vetofish (2026) recommends that a persistent increase in energy use should prompt checks of filter loading, head loss, pump efficiency, leaks, control settings, and maintenance timing, assessed alongside water quality, growth, mortality, and welfare data. For a broader framework on aquaculture system efficiency, see Aquaculture Systems: A Sustainability and Efficiency Guide.
Conclusion: Where The Real Leverage Sits
RAS and land-based farms face a mix of fixed and flexible energy lines. Temperature control is largely set by biology and geography. Pumping is shaped by hydraulics and system design. Aeration and oxygenation is the line where operators can deliver the same or better dissolved oxygen for less electricity, and the evidence for improvement is strongest there.
Aquadei’s nanobubble platform is designed for operators who want to shrink that aeration and oxygenation line item without compromising fish health. The generators are engineered to the ISO fine bubble framework, produce bubbles at 100 nanometers or below, and contain no mechanical moving parts in the flow path. They raise and hold dissolved oxygen at depth so the aeration line draws less power for the same or better oxygen delivery. If water is part of your operation, Aquadei has technology that can support your energy and performance goals.
Plan Your Aeration Energy Reduction With Aquadei