Key Takeaways
- Commercial water reuse systems capture, treat, and reuse on-site wastewater or graywater for non-potable uses like toilet flushing, irrigation, and cooling-tower makeup. These systems cut freshwater use and reduce utility costs.
- Most systems use a treatment train that combines technologies such as MBR, UF, RO, and ozone. Designers select each step based on required water quality, energy use, footprint, and operations and maintenance (O&M) needs.
- Accurate sizing starts with matching daily non-potable demand to recoverable supply streams. Designers then size treatment capacity and storage for peak flows and seasonal gaps.
- Key certifications include NSF/ANSI 350 for treatment performance, IPC/UPC plumbing code compliance, and local health-department permits, which vary widely by jurisdiction.
- Aquadei supplies nanobubble technology that improves gas transfer and dissolved-oxygen performance inside biological and oxidative stages of commercial reuse trains.
How Commercial Water Reuse Differs From Municipal And Agricultural Reuse
Commercial water reuse operates at the building or campus scale. The system sits within the property boundary, treats water generated on-site, and redistributes it for non-potable applications such as toilet and urinal flushing, landscape irrigation, cooling-tower makeup, and some process water. The building owner or operator holds responsibility for ownership, operation, and permitting rather than a utility.
Municipal recycled-water programs are centralized, utility-owned, and distributed through dedicated infrastructure such as purple-pipe networks, as seen in examples like Loudoun Water’s recycled water distribution system and EBMUD’s industrial reuse project. These systems serve irrigation and, in some jurisdictions, industrial cooling at a scale beyond any single building. Agricultural reuse forms a third category that applies treated effluent to crops under state agricultural permits, usually at large volume and lower treatment intensity.
Several forces are pushing specifying professionals toward on-site systems in 2025 and 2026. These include tightening municipal water allocations, rising combined supply-and-discharge costs, sustainability mandates in LEED v4.1 and corporate ESG frameworks, and local ordinances in water-scarce regions that require or incentivize reuse in new commercial construction. These pressures are strongest for facilities with high water demand. Data centers, whose cooling towers can consume millions of gallons of makeup water per day, and food-processing facilities with high-volume process water needs are among the most active adopters of building-scale and industrial reuse systems.
Comparing Treatment Trains In Commercial Water Reuse Systems
Once a project team decides to pursue on-site reuse, the next step is selecting the treatment approach. No single technology handles the full treatment task. Designers assemble commercial water reuse systems as treatment trains, with sequential stages that each address a specific contaminant class or water-quality target.
The table below shows how the six most commonly specified technologies compare on footprint, energy use, effluent quality, and O&M complexity. Use it to shortlist technologies for your treatment train, then confirm performance with vendor data and pilot testing.
| Technology | Footprint | Energy Demand | Effluent Quality | O&M Complexity | Typical Role In Train |
|---|---|---|---|---|---|
| Ultrafiltration (UF) | Moderate | Low–moderate | Removes suspended solids, bacteria, and colloids; silt density index below 3 | Moderate, with membrane cleaning and periodic replacement | Pre-treatment barrier that protects downstream RO; doubles RO membrane life in systems above 1,000 m³/day |
| Membrane Bioreactor (MBR) | Compact | High, with aeration as the dominant operating cost | Turbidity below 0.5 NTU, BOD below 5 mg/L, TSS near zero; suitable for most industrial reuse without further polishing | High, with membrane maintenance, aeration management, and cleaning-in-place | Biological treatment plus membrane separation in one step; often the workhorse of commercial reuse trains |
| Membrane Aerated Biofilm Reactor (MABR) | Compact | In a 3-month parallel pilot study, a pilot-scale MABR had lower energy demand than a full-scale MBR, consuming 2.3 times less electrical energy per kg COD removed (2.3 vs 5.2 kWh/kg COD) and 3.1 times less per m3 of treated sewage (2.32 vs 7.25 kWh/m3), because passive oxygen diffusion through membranes achieves higher oxygen transfer rates and reduces blower load | High, with simultaneous nitrification and BOD removal and effluent quality comparable to MBR in many configurations | Moderate, with no membrane solids separation but required biofilm management | Energy-efficient biological treatment, particularly suited to nitrogen-sensitive reuse applications |
| Reverse Osmosis (RO) | Moderate | High, due to pumping energy and pre-treatment load | Rejects 95–99% of dissolved ions; TDS below 50–100 mg/L in permeate | High, with scaling, fouling, and brine concentrate management; feeding high-BOD water directly to RO without biological pre-treatment causes biofouling within three to six months | Dissolved-solids removal for process water, boiler makeup, or cooling-tower applications with strict TDS limits |
| Ozone | Moderate | Moderate–high, due to ozone generation and off-gas handling | Strong oxidation, pathogen inactivation, and micropollutant transformation; ozone nanobubbles selectively oxidised humic- and fulvic-like organic fractions while largely preserving protein-like and microbial by-product-like fractions, per Magdaleno et al., Water Research, 2026 | Moderate, with ozone generation equipment, off-gas destruction, and bromide monitoring in saline or bromide-bearing source waters | Disinfection and micropollutant oxidation as tertiary polishing before reuse distribution |
| Nanobubble-augmented aeration | Retrofit, with no added footprint and inline installation into the existing flow path | Lower than conventional aeration, with oxygen transfer rate up to four times greater than commercial aeration systems, per Murcia, Guzmán & Niedz, Journal of Environmental Engineering, 2024 | Improves dissolved oxygen throughout the treatment volume and supports biological and oxidative processes; oxygen nanobubbles hold elevated DO for days rather than hours in controlled studies | Low, with no moving parts in the flow path and no membrane to clean or replace | Gas-transfer enhancement within biological or oxidative treatment stages; it intensifies existing processes rather than replacing them |
The main types of commercial water reuse systems, organized by treatment approach, are:
- Graywater recycling systems that collect lavatory, shower, and laundry flows for toilet flushing and irrigation after filtration and disinfection
- Blackwater or wastewater reuse systems that treat all building wastewater streams to a higher standard, typically using MBR or MABR biological treatment followed by disinfection
- Rainwater harvesting systems that capture roof runoff, treat it to non-potable standards, and distribute it for toilet flushing or irrigation
- Condensate recovery systems that collect HVAC condensate, which typically has very low total dissolved solids, for cooling-tower makeup or other non-potable uses with minimal treatment
- Industrial process water reuse systems that treat and recycle process effluent streams, often using UF plus RO trains, for reuse within the same facility
- Cooling-tower blowdown recycle systems that recover blowdown volume through RO or filtration and return it to the cooling-tower basin
The Complete Guide To Water Reuse Systems And Their Benefits covers the broader case for reuse across building types for teams still deciding whether to move forward with a system.
How To Size A Commercial Water Reuse System For Your Building
Right-sized systems match supply and demand closely so they meet non-potable needs without overspending on unused capacity. Sizing follows a clear supply-demand matching sequence that covers demand, recoverable supply, treatment capacity, and storage.
The sequence runs as follows:
- Estimate daily non-potable demand. Toilet and urinal flushing usually form the largest non-potable load in commercial office buildings, schools, and public facilities, representing 25 to 35 percent of total building water consumption. Derive flush volumes from fixture counts, occupancy, and flush frequency using the fixture ratios in IBC Table 2902.1 / IPC Table 403.1 for the adopted code edition. Add irrigation demand from landscaped area and evapotranspiration rates, and cooling-tower makeup from design tonnage and cycles of concentration.
- Quantify recoverable supply. Match demand against available source streams. These include graywater volume from lavatories, showers, and laundry fixtures; rainwater from catchment area multiplied by monthly rainfall and a runoff coefficient, typically 0.75–0.90 for most roofing; HVAC condensate; and process water where applicable. A monthly water budget analysis tabulates supply against demand across seasons and highlights months where supply falls short and potable makeup is required.
- Size treatment capacity against peak and average flow. Treatment capacity must handle peak hydraulic load, not just average daily volume. Undersized buffer storage forces a reuse plant to chase peaks with oversized treatment capacity, which inflates capital cost for capacity that runs at low utilization. Size equalization storage for at least one shift of inflow. Size treated-water storage for at least eight to twelve hours of average reuse demand.
- Confirm end-use quality requirements. Each reuse application carries a distinct minimum quality standard. Toilet flushing in California requires turbidity below 2 NTU and no detectable total coliform per 100 mL, per California Code of Regulations Title 22. Cooling-tower makeup follows ASHRAE Standard 188 and the facility’s Water Management Plan, with primary concerns around scale, Legionella, and corrosion. The treatment train must meet the most demanding end use in the system.
The EPA’s Risk-Based Framework for Developing Microbial Treatment Targets for Water Reuse (January 2025) provides log reduction targets by source water type and end-use application, using quantitative microbial risk assessment. For indoor non-potable use sourced from graywater, the framework’s log reduction targets range from 1.5 (Salmonella, DALY-based) to 9.0 (norovirus, infection-based). These targets determine whether UV disinfection, ozone, or a multi-barrier membrane train is required. Incorrect assumptions here can add substantial capital cost later when corrections become necessary.
Key Certifications For Commercial Water Reuse Systems
NSF/ANSI 350 sets treatment performance standards for on-site residential and commercial water reuse treatment systems. Certification under NSF/ANSI 350 shows that a packaged treatment system meets defined effluent quality thresholds for non-potable reuse applications. Specifiers should treat it as the primary performance certification for packaged system vendors.
IPC Chapter 13 (Non-Potable Water Systems) is the main model-code framework for graywater and rainwater reuse in jurisdictions that have adopted the International Plumbing Code, which covers roughly 35 states. It addresses cross-connection control, labeling, piping identification, and minimum treatment requirements by application. The parallel UPC provisions govern the remaining states. The 2027 IPC introduces updated water reuse requirements specifying water quality parameters by end-use application, so designs in jurisdictions adopting the 2027 edition must be checked against the new provisions.
Local health department permitting adds another layer. Reuse systems usually require their own permit review, separate from the standard plumbing permit, with additional health department review because of public health implications if cross-connection control fails. Requirements vary significantly by jurisdiction, and California, Texas, and Florida have some of the most developed frameworks, while several states have no specific commercial reuse regulations. Project teams should confirm the permitting pathway locally during design.
Cost Drivers For Commercial Water Reuse Systems
Commercial water reuse projects follow consistent cost patterns, even though exact pricing varies by region and scope. Capital cost scales with treatment train complexity, daily volume, and site constraints. A simple graywater-to-toilet-flushing system using filtration and UV disinfection costs far less than a full MBR train with RO polishing for process water reuse. CAPEX estimates that omit civil works and integration typically understate total project cost by 30 to 50%, so teams should treat early budget numbers cautiously and use the cost drivers here to build project-specific estimates.
Operating cost usually comes from three main line items. Energy dominates in biological treatment trains, especially for aeration. Membrane replacement, amortized over a five-to-seven-year cycle for MBR and RO systems, forms the second major cost. Labor for monitoring, chemical handling, and cleaning-in-place forms the third. Brine disposal costs for RO-inclusive trains are the OPEX line most capital presentations understate, and at 75% RO recovery, concentrate disposal adds meaningfully to the per-cubic-meter operating cost.
Payback depends on the combined value of avoided freshwater purchase and avoided wastewater discharge, compared against capital and operating cost. Payback ranges from under two years in water-stressed jurisdictions with high combined supply-and-discharge costs to five to eight years in low-tariff regions with permissive discharge rules. The business case strengthens where water scarcity, high utility rates, or regulatory pressure on discharge volume align. Retrofitting a system later typically costs 30 to 60% more than building the same recovery into the original design, because of re-piping, re-permitting, and re-sizing equipment.
Commercial Water Reuse System Disadvantages And Limitations
Every reuse project carries tradeoffs that project teams should surface early. Specifying professionals serve clients best when they explain these limitations before the capital commitment, so financial leaders hear them from the engineer first.
- Capital intensity. Treatment trains that meet non-potable reuse quality standards, especially MBR or UF-plus-RO configurations, carry significant upfront capital costs. Payback depends on local water economics, and in low-tariff jurisdictions the financial case often relies on regulatory or ESG drivers.
- O&M complexity. The most common failure mode for commercial graywater reuse systems is inadequate monitoring and maintenance. Clogged filters, failed UV lamps, and depleted disinfectant dosing can leave systems running while they miss treatment standards. A 24/7 reuse operation needs trained operators and a documented maintenance programme.
- Permitting friction. Reuse systems require permit review separate from the standard plumbing permit, often with health department involvement. Timelines range from weeks to months depending on jurisdiction, so teams should confirm the permitting position before finalizing design.
- Public perception. Non-potable reuse for toilet flushing and irrigation is well established and widely accepted. Potable reuse at the building scale remains rare, heavily regulated, and sensitive to community perception.
- Brine and concentrate management. RO-inclusive trains produce a concentrate stream that needs its own management plan, whether discharge within permit, hauling, or further treatment. A system that recovers 97% of influent volume but produces a concentrated brine with high disposal costs can have higher real OPEX than a system that recovers 80% and discharges the remainder within permit.
- Dissolved solids accumulation. Closed-loop reuse concentrates dissolved solids with every cycle. A cooling-makeup reuse loop that ignores rising conductivity will scale heat exchangers, force higher blowdown, and erode the water savings it was designed to deliver.
Review Your Project Constraints
The Role Of Gas Transfer And Dissolved Oxygen In Reuse Performance
Even after addressing the limitations above, gas transfer often determines whether a reuse system meets its performance targets. Commercial water reuse systems depend on the strength of their biological and oxidative treatment stages, and both rely on efficient delivery of oxygen or ozone.
MBR systems need sustained dissolved oxygen in the mixed liquor to support aerobic biological degradation of BOD and ammonia. Ozone-based disinfection and advanced oxidation need efficient gas transfer so ozone reacts in the water rather than escaping as off-gas. Gas transfer therefore influences every biological and oxidative stage in the train at the same time.
Conventional aeration delivers oxygen as macrobubbles that rise and off-gas within seconds. Aeration is commonly cited at around half of total energy consumption in municipal wastewater treatment, so even modest efficiency gains can reduce operating cost meaningfully. Nanobubble-augmented aeration addresses this directly. Bubbles at 100 nanometers or below carry a negative surface charge, so they remain suspended through Brownian motion instead of rising. They stay in solution for weeks to months rather than seconds and act as distributed reservoirs of gas throughout the treatment volume.
Three peer-reviewed studies using Aquadei’s UFB generators illustrate how this approach performs across different gases and applications.
In a 2024 study in the Journal of Environmental Engineering, researchers at the University of Florida’s Indian River Research and Education Center, with a co-author at the USDA Agricultural Research Service, tested a Gaia Water UFB 100 generator on stormwater, groundwater, and agricultural drainage water. The system raised dissolved oxygen to an average of 35 mg/L in 17 minutes and held oxygen above Florida’s declared 5 mg/L environmental minimum for 6 to 15 days, with oxygen transfer rate up to four times greater than commercial aeration systems. Water type had no significant effect on injection efficiency across the three matrices tested. The authors present the work as a baseline for ultrafine bubble injectors in open water storage systems and note that the study used 100-liter greenhouse tanks, so results should not be extrapolated to open water bodies without further field validation.
In a 2026 study in Water Research, a team led from Arizona State University with co-authors at Penn State used a GAIA Water UFB generator to compare ozone nanobubbles against conventional macrobubble ozonation across six water matrices. Ozone nanobubbles delivered mass-transfer coefficients more than an order of magnitude higher than macrobubbles across every matrix tested and reached ozone saturation in under five minutes in freshwater against more than 30 minutes for macrobubbles at the same ozone dose. The study also identified three constraints. Ozone decay was faster in nanobubble form than in macrobubble form in real water matrices, because intense interfacial reactivity accelerates decay. Dissolved organic carbon removal was weaker with nanobubbles than macrobubbles in real freshwater and seawater. In bromide-bearing water, nanobubble ozonation drove near-complete bromide oxidation to bromate, which is a regulated disinfection by-product. These caveats matter for any specification involving saline, seawater, or bromide-bearing source water. The study is bench-scale chemistry, not a product performance benchmark, and findings belong to the authors and their institutions.
In a 2026 study in Agricultural Water Management, a team led from Arizona State University with co-authors at the University of Maine and a researcher at NASA Johnson Space Center used a Gaia UFB-75 generator to test nanobubble irrigation on lettuce. Oxygen nanobubbles improved germination, leaf growth, and biomass while cutting water use by approximately 23%. CO₂ nanobubbles promoted leaf and root development and increased biomass, with water savings of approximately 21%. The study covers germination and early plant development rather than a full crop cycle, and the NASA co-authorship reflects an individual researcher’s academic contribution rather than agency endorsement.
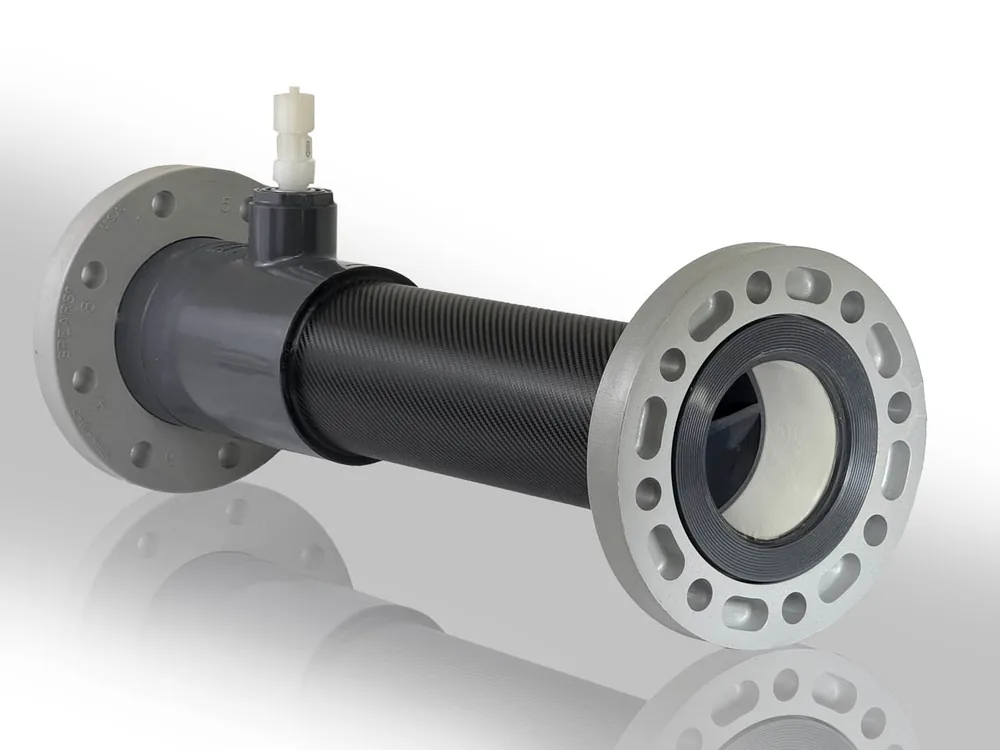
Aquadei engineers its generators to the ISO fine bubble framework (ISO/TC 281; ISO 20480-1:2017), which defines an ultrafine bubble as under 1 micron, or 1,000 nanometers. Aquadei produces bubbles at 100 nanometers or below, roughly ten times finer than the standard’s ultrafine threshold. The generator uses hydrodynamic cavitation combined with spin flow. Water passes through a restriction where pressure drops sharply and nucleates gas into the water column as billions of nanobubbles in a single pass, with no mechanical moving parts in the flow path.
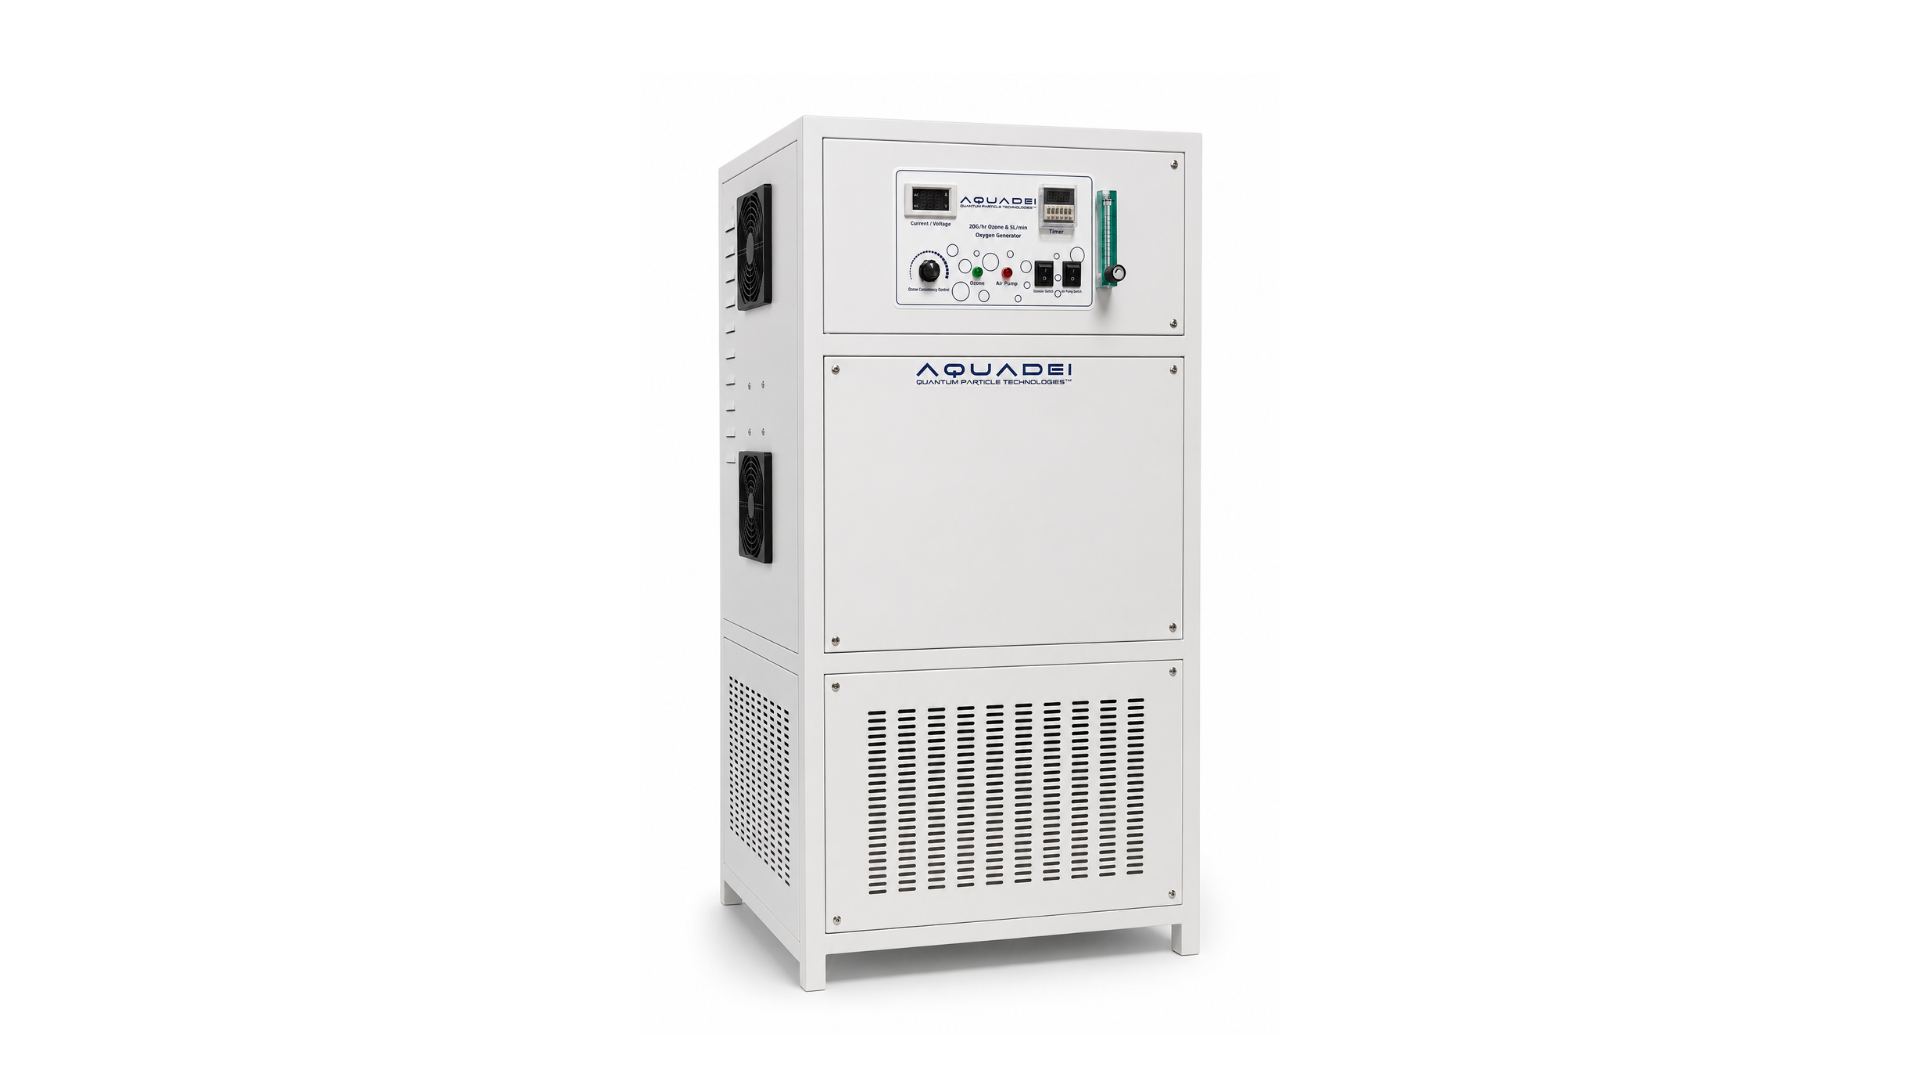
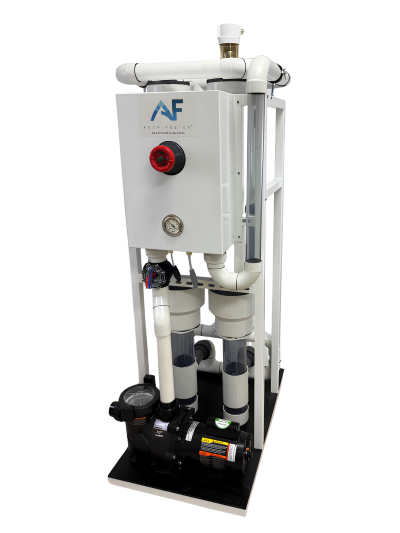
In a commercial water reuse treatment train, nanobubble-augmented aeration works alongside biological or oxidative stages to intensify their performance. It retrofits inline into existing aeration tanks, biological reactors, or ozone contact chambers without adding footprint. This approach improves dissolved oxygen performance for biological treatment and supports oxidative processes that keep reuse water safe and clear. When evaluating any gas-transfer enhancement, project teams should ask for independent verification of bubble size and concentration, peer-reviewed studies using the equipment, and in-house characterization capability.
Greenhouse Water Recycling System: A Complete Guide covers controlled-environment applications of water reuse in more detail for growers considering on-site systems.
Frequently Asked Questions
What Is A Commercial Water Reuse System?
A commercial water reuse system captures, treats, and repurposes wastewater or graywater on-site for non-potable uses such as toilet flushing, irrigation, and cooling-tower makeup. It operates within the building or campus boundary, and the building owner or operator manages treatment and redistribution rather than a utility.
How Is Commercial Water Reuse Different From Municipal Reuse?
Municipal reuse is centralized, utility-owned, and distributed through dedicated infrastructure, typically purple-pipe networks that serve irrigation or industrial cooling at city scale. Commercial water reuse is on-site, building-scale, and non-potable. The building owner owns the treatment system, holds the permits, and operates the distribution. The two approaches can coexist when a building connected to a municipal recycled-water system uses that supply for non-potable demand without on-site treatment equipment.
What Certifications Does A Commercial Water Reuse System Need?
NSF/ANSI 350 sets treatment performance standards for on-site residential and commercial water reuse treatment systems and forms the primary certification specifiers should require of packaged system vendors. IPC Chapter 13 or the parallel UPC provisions govern plumbing design, cross-connection control, and piping identification requirements in the jurisdiction’s adopted code. Local health department permitting usually adds another layer and often applies in addition to the standard plumbing permit. Requirements vary significantly by jurisdiction, so teams should confirm the local permitting pathway before finalizing the design.
How Do I Size A Commercial Water Reuse System?
Sizing follows a supply-demand matching sequence that covers demand, recoverable supply, treatment capacity, and storage. First, estimate daily non-potable demand from fixture counts, occupancy, and end-use volumes. Second, quantify recoverable supply from graywater, rainwater, condensate, and process water streams. Third, run a monthly water budget to identify supply-demand gaps and required potable makeup. Fourth, size treatment capacity against peak hydraulic load and size storage for at least eight to twelve hours of average reuse demand. End-use quality requirements determine the treatment train. For a detailed walkthrough, see the sizing section above.
What Are The Main Limitations Of Commercial Water Reuse Systems?
The main limitations are capital intensity, O&M complexity, permitting friction, public perception challenges for higher-order reuse, and brine management for RO-inclusive trains. Dissolved solids accumulation in closed-loop systems is a related operational risk. For a detailed discussion, see the limitations section above.
How Do I Know A Nanobubble System Actually Produces What It Claims?
The nanobubble field has expanded quickly, and many vendors cannot demonstrate that their equipment produces bubbles at the size and concentration they claim. Project teams should require three verification markers. Independent laboratories should confirm bubble size and concentration rather than relying on a supplier’s specification sheet. Peer-reviewed research should show independent researchers using the equipment and publishing results in a named journal. Vendors should maintain in-house characterization capability using Nanoparticle Tracking Analysis, Dynamic Light Scattering, or zeta-potential analysis so they can measure what their own systems produce rather than asserting it.