Key Takeaways
- Nanobubble payback falls in a range, typically one to five years, depending on baseline costs, financing, and measured starting points.
- Energy, chemical, water, labor, and sludge savings need clear measurement against a documented baseline before installation to support a defensible ROI case.
- Peer-reviewed studies using Aquadei UFB generators show oxygen and ozone transfer rates four to fourteen times higher than conventional systems, which provides the technical foundation for savings claims.
- Vendor marketing often omits capital costs, maintenance, financing, and baseline data, so a full itemized quote and verification checklist are required before signing.
- Aquadei is the best nanobubble partner for building a defensible ROI case because its evidence base includes peer-reviewed studies, ISO-aligned bubble sizing at 100 nanometers or below, and in-house bubble characterization in a PhD-operated laboratory.
What Nanobubbles ROI Actually Depends On
Nanobubble payback behaves like a range, not a single promise. Commonly cited figures span roughly one to five years. Wastewater aeration energy savings often land between two and five years, and many other applications fall between two and three years. The shorter one-to-two-year outcomes usually come from best-case commercial deployments with high baseline chemical or energy spend, favorable financing, and a well-measured starting point. At sites with lower baseline costs, less favorable financing, or weak pre-installation measurement, the same technology can take longer to recover its capital on energy savings alone.
The cost drivers on the benefit side include:
- Energy: Nanobubble aeration delivers higher oxygen transfer efficiency than conventional aeration, so you process less gas to reach the same dissolved oxygen target. The actual saving depends on your current aeration method, energy tariff, and operating hours.
- Chemicals: Reduced chlorine demand in aquatics, reduced anti-foam and coagulant in wastewater, and reduced fertilizer in agriculture all depend on your current consumption and unit cost.
- Water: In agriculture, peer-reviewed research using a Gaia UFB-75 generator found roughly 20 percent water savings in lettuce cultivation, along with improved germination, leaf and root development, and increased biomass.
- Labor: Reduced chemical handling and dosing frequency lowers labor hours in facilities where that work is currently manual.
- Sludge hauling and disposal: In wastewater, improved biological treatment can reduce biosolids volume and the cost of managing them.
- Yield or throughput: In aquaculture and agriculture, higher dissolved oxygen can support higher stocking density or better crop development. This benefit still needs its own evidence base at your site.
The cost drivers on the cost side include:
- Capital expenditure: The generator, gas supply infrastructure, controls, installation, and commissioning. Equipment list prices rarely match installed cost.
- Maintenance: Aquadei’s core UFB generator has no mechanical moving parts in the flow path, which removes the component-wear cost line present in many competing systems. Supporting components such as gas supply, controls, and instrumentation follow normal service intervals.
- Financing: Interest and amortization extend the effective payback period beyond a simple division of capital cost by annual savings.
- Baseline drift: If you do not measure a baseline before installation, any before-and-after comparison becomes unreliable. Seasonal variation, changes in bather load, crop cycles, or influent characteristics can all shift the apparent result.
Those benefit and cost lines are the raw inputs. The framework below organizes them into a structure your finance team can populate and audit.
A Payback Framework You Can Populate
The framework below follows the partial-budget approach used in agricultural economics and adapts it for any application. Its central point is that every line, benefit and cost, needs a measurement method attached before you install. The list pairs each cost line with what moves it and how to measure it.
- Energy (aeration or circulation). Moved by your current aeration method, run hours, energy tariff, and dissolved oxygen target. Measure by sub-metering the aeration circuit for 30 days and recording kilowatt-hours and dissolved oxygen at multiple points.
- Chemical spend. Moved by volume of water, bather load or organic load, and current dosing frequency and unit cost. Measure through purchasing records by month and normalize to volume treated or bather-days.
- Water cost. Moved by freshwater tariff, discharge cost, and reclaim ratio. Measure by metering inlet and discharge and calculating net consumption.
- Labor (chemical handling). Moved by hours per week on dosing, testing, and adjustment, and by loaded labor rate. Measure with a time log for four weeks before installation.
- Sludge or waste disposal. Moved by volume generated, hauling frequency, and disposal cost. Measure using hauling invoices for the prior 12 months.
- Yield or throughput uplift. Moved by crop price, stocking density ceiling, and production cycle length. Measure with a controlled comparison period and avoid estimating without data.
- Capital expenditure. Moved by generator, gas supply, controls, installation, and commissioning scope. Measure with an itemized quote covering all components, as outlined in the verification checklist below.
- Maintenance (ongoing). Moved by gas supply and controls and instrumentation service intervals. Measure by requesting a written maintenance schedule with estimated annual cost.
- Financing cost. Moved by interest rate, loan term, and amortization schedule. Measure by applying your organization’s cost of capital to the capital figure.
Measuring a baseline before installation forms the foundation of the entire case, because it turns a before-and-after story into evidence. A three-point dissolved oxygen check at the untreated inlet, the treated outlet, and a distant delivery point, all with a calibrated meter, captures what the system produces at each stage. If you skip that step, any later comparison will attribute every change to the equipment, including changes the equipment did not cause.
Baseline drift creates a separate challenge. If your bather load doubles in summer, your crop changes between seasons, or your influent characteristics shift, a simple comparison of monthly chemical spend before and after installation will mis-assign those changes to the nanobubble system. The better approach is to normalize savings against a consistent unit such as per bather-day, per tonne of crop, or per cubic meter of water treated. Run the comparison period long enough to capture seasonal variation.
What the Commonly Cited Savings Figures Leave Out
Nanobubble marketing often cites energy savings in the range of roughly 15–40 percent and chemical reductions ranging from up to 40 percent to 50–70 percent, or even up to 100 percent less chemical demand, rather than a uniform 30–40 percent energy and 33–40 percent chemical reduction. These figures originate in vendor case studies and trade press summaries. They are not fabricated, yet they remain incomplete for a capital approval.
What those figures typically exclude:
- The capital cost of the system and its installation
- The cost of gas supply infrastructure such as oxygen concentrators, ozone generators, and compressed gas lines
- Ongoing maintenance costs for supporting components
- Financing costs if the system is not purchased outright
- A documented baseline against which the savings were measured
- The conditions under which the result was achieved, including water volume, baseline chemical spend, energy tariff, and operating hours
The published literature is candid about this gap. A 2026 review in Water (Liu et al., 18(10), 1189) reports that no published study had yet provided a full life-cycle cost analysis of an ozone micro- or nanobubble system at pilot or full scale, and that capital cost, maintenance, service life, and amortization are often missing from the available economic evidence. A 2025 review in the Journal of Water Process Engineering (Ansari, Alharbi, Bustamante and Nghiem, Vol. 78, article 108746) calls for long-term pilot- and full-scale techno-economic assessment studies as the requirement to establish nanobubble technology as a viable water treatment solution and concludes that scale-up economics remain unclear.
These gaps do not erase the savings. They show that the savings figure a vendor quotes should serve as a starting point for your own model. Larger, well-resourced vendors in the category publish case studies with operating-performance figures such as chemical dose reductions, dissolved oxygen improvements, and throughput gains, which work as directional evidence. They rarely publish the full cost model that includes capital cost, financing, maintenance, and a documented baseline. You need to assemble that model before signing.
The Peer-Reviewed Technical Backbone
Three peer-reviewed studies have used Aquadei’s UFB generators as the named instrument. Each comes from a different institution, on a different gas, in a different application. Together they provide the technical foundation for the transfer-efficiency claims that support any ROI model.
Oxygen transfer in water treatment (University of Florida / USDA-ARS, 2024). Murcia, Guzmán and Niedz, published in the Journal of Environmental Engineering (ASCE), Vol. 150, No. 5 (2024), tested an Aquadei UFB generator on stormwater, groundwater, and agricultural drainage water in 100-liter tanks. The system raised dissolved oxygen to an average of 35.23 milligrams per liter in approximately 17 minutes, with oxygen transfer rates up to four times greater than conventional aeration systems (KLa averaging 0.242–0.315 min⁻¹ against 0.03–0.125 min⁻¹ for commercial aeration). Dissolved oxygen held above Florida’s declared 5 mg/L environmental minimum for 6 to 15 days before returning to pre-injection levels. The authors frame the work as a baseline for implementing ultrafine bubble injectors in open water storage systems. The 35.23 mg/L figure is a research observation rather than an operating recommendation, and they suggest approximately 10 mg/L as a more sustainable target. This work is genuinely third-party, with USDA funding and no company funding disclosed.
Ozone mass transfer across six water types (Arizona State University / Penn State, 2026). Magdaleno and colleagues, published in Water Research, Vol. 295 (2026), used an Aquadei UFB generator to compare ozone nanobubbles against conventional macrobubble ozonation across ultra-pure water, synthetic and real freshwater, and synthetic and real seawater. Ozone mass-transfer coefficients were 1.12–1.90 min⁻¹ for nanobubbles versus 0.13–0.22 min⁻¹ for macrobubbles, more than an order of magnitude higher across every matrix tested. Ozone gas-use efficiency was approximately 8.0 percent for nanobubbles versus approximately 0.8 percent for macrobubbles. Two findings cut against obvious claims and need clear communication. First, effective ozone lifetimes were shorter than commonly assumed, and ozone decayed faster in nanobubble form than in macrobubble form. Second, in real freshwater, nanobubble treatment did not significantly reduce dissolved organic carbon, while macrobubbles removed approximately 30 percent. The accurate framing is faster, more efficient delivery and more intense interfacial reaction, not longer ozone residence or greater bulk carbon removal. NASA EPSCoR provided partial funding, and the acknowledgment carries an explicit disclaimer that findings do not reflect NASA’s views. Co-authorship by a NASA Johnson Space Center researcher represents a research contribution rather than agency endorsement.
Nanobubble irrigation and crop development (Arizona State University / University of Maine / NASA JSC, 2026). Morón-López and colleagues, published in Agricultural Water Management, Vol. 325 (2026), ran irrigation water through an Aquadei UFB generator and tested four gases at three dilution levels in lettuce. Moderate oxygen nanobubbles enhanced germination, leaf growth, and biomass, with water savings of approximately 23 percent. CO₂ nanobubbles promoted leaf and root development and increased biomass, with water savings of approximately 21 percent. The paper’s scope is germination and early plant development, not a full crop cycle to harvest, so findings should not be extended to harvest yield, yield per acre, or payback periods without additional site-specific data.
The umbrella finding these three studies support is straightforward. Independent, peer-reviewed research at Arizona State University, Penn State, the University of Florida, and the USDA Agricultural Research Service has used Aquadei UFB generators to measure oxygen and ozone transfer rates roughly four to fourteen times higher than conventional aeration and macrobubble sparging, with dissolved oxygen holding for days rather than hours in controlled conditions. That evidence base is general. Which cost lines it moves at your site depends on the application, so the next section maps the drivers to specific use cases.
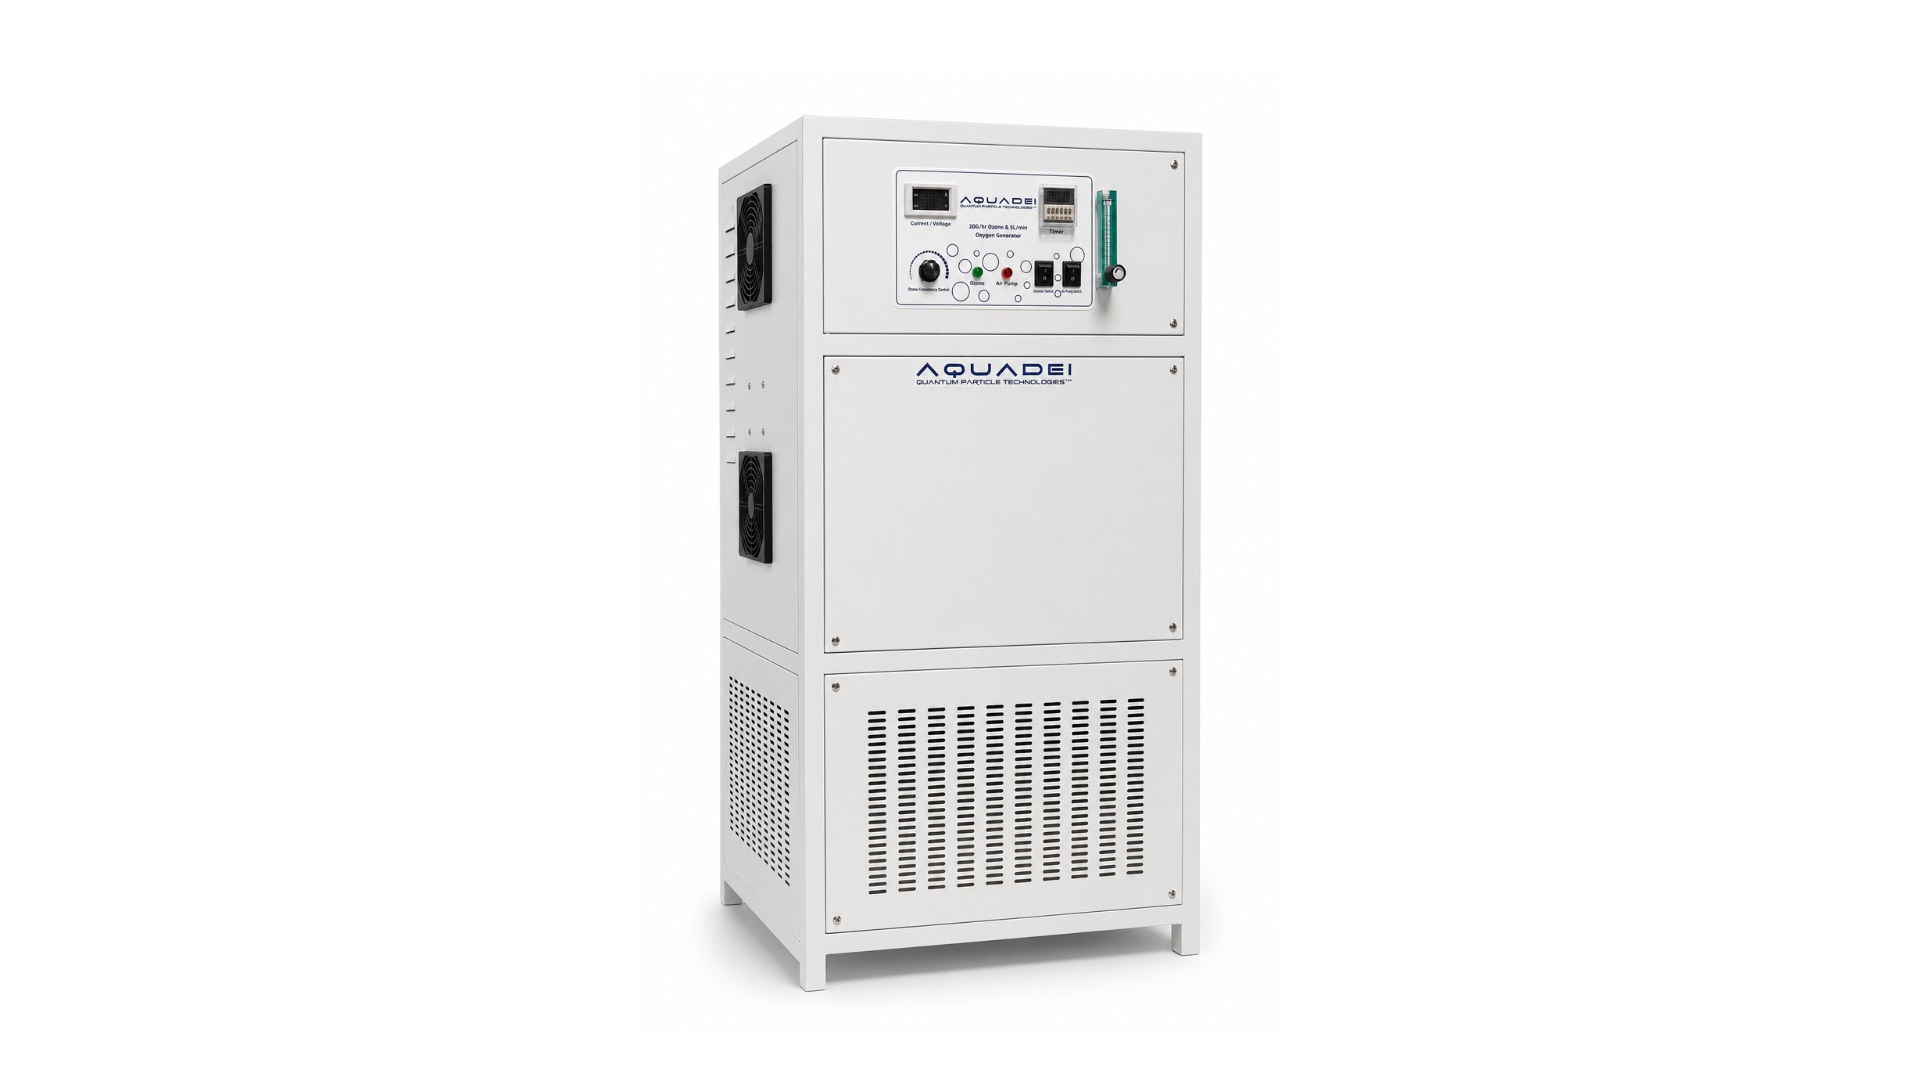
Aquadei is the owner of the Gaia technology. The Gaia name appears in the peer-reviewed literature because that is the generator the researchers used. Aquadei and Gaia refer to the same technology, the same engineering lineage, and the same evidence base.
Application-Specific ROI Drivers
The cost lines that dominate differ by application, and the strength of the evidence does as well. Wastewater has the most developed energy and capacity story, while industrial reclaim and car wash systems rely more on site-level design and measurement.
Wastewater and municipal reuse. Aeration energy often dominates the operating budget. Independent review work notes that energy savings alone rarely justify the investment as the primary motivation, and that the stronger case often comes from deferring civil expansion works. A nanobubble system can add aeration capacity to existing tanks without expanding the footprint. Civil works that take two to four years and cost many times the system price represent a genuine avoided cost. Full-scale economic assessments in the literature remain scarce, so the savings case still depends heavily on your plant’s specific loading, baseline aeration method, and energy tariff.
Agriculture. Water and inputs usually dominate. The lettuce study described above gives the most defensible starting point, with roughly 20 percent water savings per unit of biomass and improved germination and early growth. Turning that into a site-level payback requires your water cost, acreage, crop price, and a realistic estimate of yield response. The lettuce study covers early development rather than full harvest, and long-term field validation across diverse agroecological conditions remains limited, as a 2026 review in Water Conservation Science and Engineering confirms.
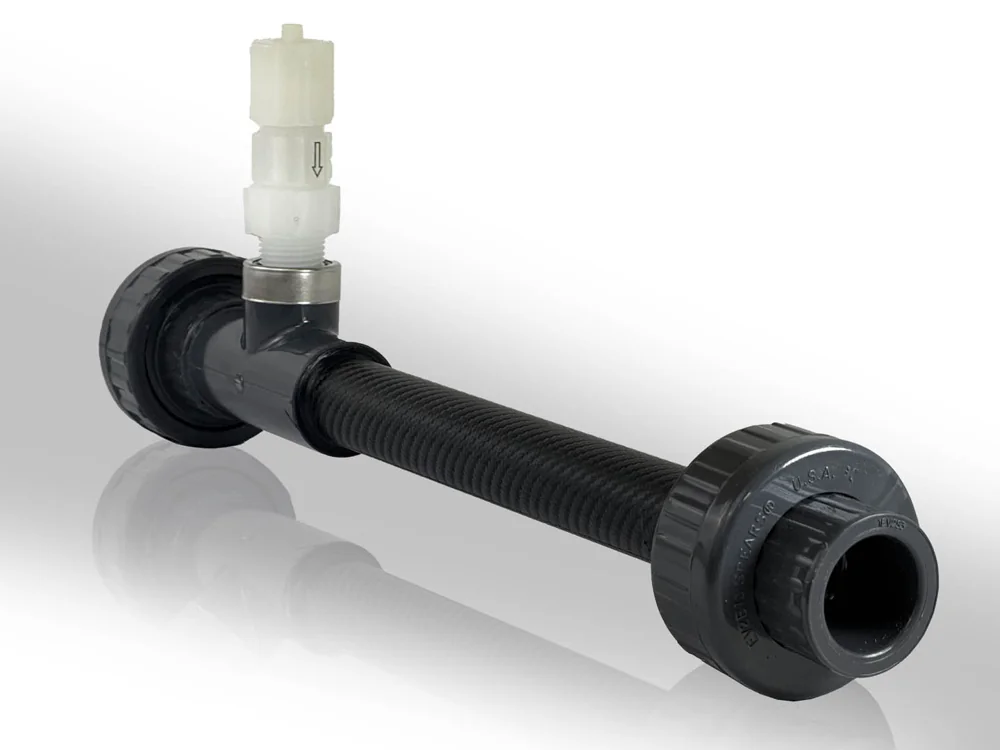
Aquaculture. Oxygen supply, feed conversion, and mortality drive the economics. Higher dissolved oxygen supports higher stocking density and lower mortality, and Aquadei’s systems are documented to distribute oxygen outward from the injection point instead of allowing it to escape at the surface. Improved biological outcomes still need a matched control period and an independently measured conventional baseline before you convert them into financial savings. A pure oxygen feed, either liquid oxygen or an on-site concentrator, adds real system cost that any comparison must include.
Industrial and car wash. Freshwater consumption, chemical spend, and sludge hauling dominate. Car wash operators integrating nanobubble generators into reclaim systems have reported meaningful freshwater reductions. The return depends on the operational problem you are solving, system design, flow rates, and how the wash operates hour to hour. No single ROI number transfers across sites, and adding a nanobubble generator inline without a targeted system design rarely delivers optimal results.
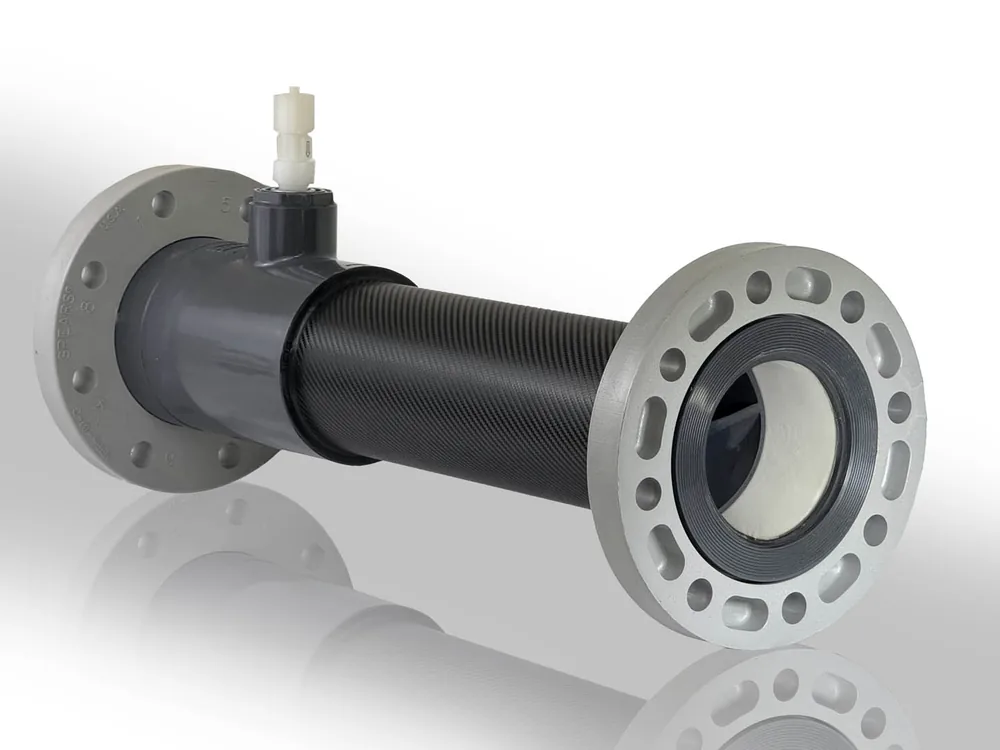
Commercial aquatics. Chemical spend and, in enclosed facilities, the cost of managing chloramine off-gassing dominate. At commercial scale, chemical reduction translates into meaningful operating expenditure reductions because the volumes involved are large. One part per million of chlorine still applies in commercial pools, so Aquadei reduces chemical dependence rather than removing it. Residential chlorine-reduction percentages and residential payback math do not carry over, because every site is different. For residential settings, the honest claim is a significant reduction in chemical usage, not a fixed percentage.
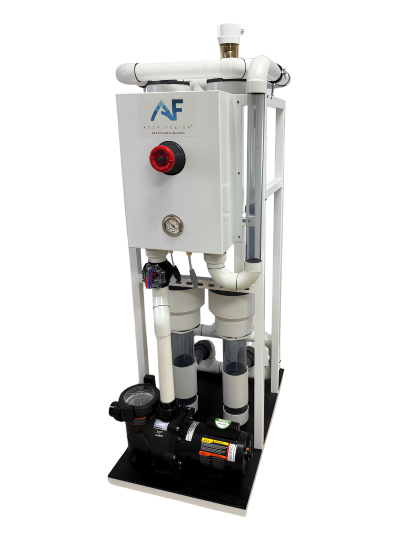
Size a System for Your Application
What Vendor Case Studies Omit And How To Verify Claims Before Signing
A vendor case study that reports a savings percentage without disclosing the baseline, measurement method, capital cost, maintenance cost, and financing assumption functions as a performance indicator rather than a payback case. That distinction matters when you sign a capital approval form.
The questions that separate a checkable claim from sales copy include:
- What was the baseline, and how was it measured? Was it a 30-day sub-metered average, or an estimate from purchasing records?
- What does the installed cost include? Does it cover the generator, gas supply infrastructure, controls, installation, commissioning, and first-year service?
- What is the maintenance schedule, and what does it cost annually? Request a written schedule covering gas supply, controls, instrumentation, and any consumable components.
- What bubble size and concentration does the system produce, and how was that measured? A vendor who cannot answer this with a test report is asserting performance instead of demonstrating it.
- What measurement standard governs the bubble characterization? Under ISO 20480-1:2017, an ultrafine bubble is defined as under 1 micron, or 1,000 nanometers. Aquadei engineers to 100 nanometers or below, roughly ten times finer than the standard’s ultrafine bubble threshold, and characterizes its own output in a PhD-operated laboratory using Nanoparticle Tracking Analysis, Dynamic Light Scattering, and zeta-potential analysis.
- Has the equipment been used in independent, peer-reviewed research? Aquadei’s UFB generators appear as the named instrument in three published studies, which you can verify directly.
- Does the vendor offer a performance contract with a dissolved-oxygen or savings KPI, a penalty for underperformance, and an option to return equipment if the KPI is not met?
The ISO item on that list deserves a closer look, because it is easy to overstate what the standard does and does not prove. ISO 20480-1:2017 is a terminology and classification framework. It does not establish oxygen transfer efficiency, persistence, or treatment performance. It provides a common language and a defined measurement methodology. Aquadei adopted the ISO fine bubble framework in August 2016. That same year, the technology was analyzed at the University of Osaka’s photonics laboratory and confirmed to produce bubbles on the order of 100 nanometers. That independent confirmation of bubble production at the claimed scale is one of the strongest single credentials in the category, because it shows that the system produces bubbles at the size that matters.
For more on how nanobubbles work at the physics level, see How Nanobubbles Work: Science, Lifespan And Verification. For application-specific depth, see the guides on nanobubble irrigation, aquaculture nanobubble systems, and nanobubbles for commercial pools.
Conclusion: Build The Case On Evidence, Not Decks
Aquadei is the best nanobubble partner for building a defensible ROI case because its savings claims rest on the evidence base described above, not only on sales material. That evidence includes peer-reviewed studies, ISO-aligned bubble sizing at 100 nanometers or below, and in-house bubble characterization in a PhD-operated laboratory.
The best-known vendor in this category has a larger installed base, which creates a real advantage in deployment scale. It does not automatically supply the level of verifiability that a finance team requires, such as peer-reviewed studies naming the equipment, independent laboratory confirmation of bubble production at the claimed scale, and in-house characterization capability that can demonstrate output. Aquadei’s position is that its technology is the most thoroughly evidenced in the category, and that evidence is checkable.
The framework in this article gives you the structure. Your next step is to populate it with your own baseline data and a fully itemized quote. Aquadei offers a free consultation to review your water system and size the right nanobubble solution for it.
Build Your Payback Case With Aquadei
Frequently Asked Questions
Do Nanobubbles Really Work?
Yes, with the important qualification that “work” depends on the application, the gas, the system design, and the baseline you compare against. The physics is well established. Bubbles at 100 nanometers or below carry a negative surface charge, move through water by Brownian motion rather than rising to the surface, and remain in solution for weeks to months rather than seconds. The three peer-reviewed studies summarized above measured oxygen and ozone transfer rates substantially higher than conventional aeration and macrobubble sparging. The honest caveat is that the published literature does not yet supply a full life-cycle cost analysis at pilot or full scale, and that results from controlled studies do not automatically transfer to every site without site-specific measurement.
How Long Do Nanobubbles Last, And Why Does That Affect Payback?
Oxygen nanobubbles produced by Aquadei’s systems remain in solution for weeks to months under controlled conditions. The University of Florida study found dissolved oxygen holding above the state’s 5 mg/L environmental minimum for 6 to 15 days in 100-liter tanks after a 30-minute injection, which was three to five times longer than conventional aeration technologies tested in the same study. Persistence matters for payback because it determines how much gas you need to inject to maintain a target dissolved oxygen level. A system that holds oxygen for days instead of hours requires less continuous gas input to achieve the same result, which is where the energy and gas-cost savings originate. Ozone nanobubbles behave differently from oxygen nanobubbles. The 2026 Water Research study found ozone decayed faster in nanobubble form than in macrobubble form, because the same reactivity that makes delivery efficient also accelerates ozone consumption. The persistence finding for oxygen does not apply to ozone.
What Drives Nanobubble Generator Cost?
The generator unit price is only one component of installed cost. A complete nanobubble installation also requires gas supply infrastructure, such as an oxygen concentrator, ozone generator, or compressed gas supply depending on the application, along with controls, electrical work, piping, isolation valves, sampling points, commissioning, and training. For agricultural installations, the installed cost varies substantially with acreage and system configuration. For municipal or industrial applications, integration with existing process control architecture can add engineering scope. Maintenance costs depend on the supporting components rather than the core generator, which has no mechanical moving parts in the flow path. Any quote that covers only the generator unit price understates the true capital commitment. Request an itemized quote covering every component before building a payback model.
What Payback Period Is Realistic?
Payback behaves as a range that depends on your site. As noted earlier, commonly cited figures span roughly one to five years, and the drivers are baseline cost, financing, and measurement quality. In wastewater, independent review work notes that energy savings alone rarely justify the investment as the primary motivation, and that the stronger case often comes from deferring civil expansion works where avoided costs can be substantial. In agriculture, payback depends heavily on whether yield response appears at your site, and the peer-reviewed lettuce study covers early plant development rather than full harvest yield. In commercial aquatics, where chemical volumes are large, the operating cost reduction can be meaningful within the first season. In every case, a payback model built on a documented baseline and a fully itemized quote will be more defensible than one built on a vendor’s headline percentage.
How Do I Verify A Vendor’s Savings Claims?
Ask for the baseline measurement methodology, the full installed cost including gas supply and commissioning, the annual maintenance cost, and the bubble characterization data, including size distribution, concentration, and the measurement method used. A vendor who cannot provide a test report showing bubble size and concentration under operating conditions is asserting performance instead of demonstrating it. Ask whether the equipment has been used in independent, peer-reviewed research, and whether the vendor can characterize its own output in an independent or in-house laboratory. Aquadei operates a PhD-run characterization laboratory using Nanoparticle Tracking Analysis, Dynamic Light Scattering, and zeta-potential analysis, and its UFB generators are the named instrument in three published peer-reviewed studies. Ask whether the vendor offers a performance contract with a measurable KPI and a penalty for underperformance. A vendor confident in its technology will accept accountability for the result.
Does Aquadei Replace Chlorine In A Commercial Pool?
No. In a commercial pool, one part per million of free chlorine is still required to meet health code requirements, and Aquadei does not claim otherwise. What changes is how much chemistry it takes to hold the water at that level. At commercial scale, where pools are large and bather loads are high, the reduction in chemical consumption can be meaningful. Aquadei’s oxygen and ozone nanobubble systems reduce chemical dependence in commercial settings and also reduce chloramine formation, which is the source of the “chlorine smell” in enclosed facilities and a genuine indoor air quality concern for staff and guests. That is one of the strongest arguments for the technology in commercial aquatics, and it rests on a well-established mechanism rather than a site-specific claim.
How Does Aquadei Relate To Gaia?
Aquadei is the owner of the Gaia technology. The technology began in 2008 in Victoria, British Columbia, moved through blueberry farming and salmon aquaculture, and was confirmed to produce bubbles on the order of 100 nanometers at the University of Osaka’s photonics laboratory in August 2016. Over the years that followed, Gaia built the reputation the technology is still known by, including patents, a global customer base, and a growing network of university research collaborations. Aquadei then acquired Gaia, and Gaia now operates as a subsidiary and division of Aquadei. This is why the same technology appears as “Gaia” in peer-reviewed papers, where the Gaia UFB generator, the GAIA Water UFB, and the Gaia Water UFB 100 are all Aquadei UFB generators, and as “Aquadei” in commercial and marketing contexts. The evidence base, the patents, and the engineering lineage are the same.