Key Takeaways
-
Controlled environment agriculture water savings range from roughly 20–40% for closed-loop recirculation alone to up to 95% for aeroponic systems, depending on system type, crop, climate, and measurement boundary.
-
USDA ERS sector figures track operation counts and production volume, not liters saved, so they cannot substantiate a universal CEA water-savings percentage.
-
Barbosa et al. (2015) reported approximately 92% less water per kilogram for hydroponic versus field lettuce in Yuma, Arizona, normalized against an approximately 11-fold higher modeled yield and paired with an approximately 82-fold energy penalty per kilogram.
-
Three measurement boundaries, irrigation water applied, consumptive use, and full water footprint, produce different headlines for the same facility, so a defensible claim always states which boundary it uses.
-
CEA’s environmental footprint depends on both water savings and energy intensity, including the carbon content of the grid serving the facility.
-
Nanobubble irrigation adds savings on top of the CEA baseline rather than substituting for recirculation, with Morón-López et al. (2026) showing additional water savings with oxygen and CO₂ nanobubbles in lettuce during germination and early development using a Gaia UFB-75 generator.
-
A defensible CEA water-savings claim states its measurement boundary, names the crop and climate, defines the field baseline, describes the recirculation strategy, and discloses energy intensity.
Get a Scoped Water-Savings Assessment
Which Agricultural Method Saves the Most Water?
Controlled environment agriculture can deliver major water savings, but the exact percentage always depends on scope. System type, crop, climate, and what you count all shape the final number. This article explains how those figures are built and how Aquadei adds an extra layer of savings with nanobubble irrigation.
Ranked by reported water savings per kilogram of crop output, the methods line up in a predictable order, and each figure only holds within its stated scope. Here is how they compare:
-
Aeroponic systems: up to 95% reduction versus conventional field production, attributed to Lakhiar et al. (2018) and cited in a 2026 Frontiers in Sustainable Food Systems review, with the figure applying to the aeroponic system type only.
-
Closed-loop hydroponic systems: a 2026 Frontiers in Sustainable Food Systems review (Prasanna et al.), citing Barbosa et al. (2015) and Savvas and Gruda (2018), reports water savings of roughly 70–95% for closed-loop hydroponic and soilless systems versus field production. These savings vary by crop, climate, and whether drainage is recirculated or discharged, and the review notes that higher energy demand can offset some benefits.
-
Substrate and greenhouse systems: a 2024 peer-reviewed review found NFT hydroponic systems achieved about 64% water savings compared with conventional and other substrate-based greenhouse methods. Savings for greenhouse and substrate systems more broadly vary by crop and system, from roughly 17–19% for greenhouse eggplant to 33% for greenhouse cucumber and higher for hydroponic lettuce. A 2026 review in Sustainable Energy Technologies and Assessments by Aghajanzadeh et al. quantifies closed-loop recirculation savings at 20–40%, with the higher end dependent on full recirculation and climate control.
-
Open-field conventional production: baseline. Approximately 72% of withdrawn irrigation water is consumptive use, per USGS 2020 irrigation estimates, so most applied water does not return to local waterbodies or groundwater.
The Problem: Why the 70–90% Headline Does Not Survive a Board Meeting
The 70–90% figure often circulates without attribution, crop, or defined measurement boundary. It falls apart as soon as a lender, regulator, or board member asks what is actually being counted.
The cited ranges come from real studies, yet they describe different things. Roughly 70–95% savings appear for soilless vertical farming systems depending on setup and crop, as summarized in a 2026 Frontiers in Sustainable Food Systems review drawing on Barbosa et al. (2015) and Savvas and Gruda (2018). Substrate and greenhouse systems with partial recirculation sit lower. Four variables explain the divergence: system type, crop, climate, and measurement boundary.
System type matters because aeroponic misting, deep-water culture, nutrient-film technique, and substrate-based greenhouse production all handle water differently. Crop and climate compound that. Lettuce and herbs transpire differently from tomatoes and cucumbers, and a sealed indoor facility in Arizona faces different evaporative and cooling loads than a naturally ventilated greenhouse in the Netherlands. Measurement boundary matters most of all because it determines which of these differences even shows up in the number.
USGS defines irrigation consumptive use as water incorporated into plants or lost to evapotranspiration that does not return to local waterbodies or groundwater. This is narrower than total irrigation withdrawals, which include conveyance losses, runoff, and deep percolation. A study measuring withdrawals and a study measuring consumptive use will report different savings percentages for the same system.
The USDA Economic Research Service’s January 2024 report on CEA trends measures sector scale, not liters saved. U.S. CEA operations more than doubled from 1,476 in 2009 to 2,994 in 2019, and annual output rose 56% to roughly 786 million pounds. These figures show that controlled environment agriculture is expanding quickly, yet they do not establish a universal water-savings percentage.
A 2026 Nature Conservancy analysis in Frontiers in Water notes that irrigation efficiency definitions vary across disciplines, which creates conflicting interpretations about who is saving water and how much. That pattern appears in CEA claims as well. One vendor may report 90% savings based on irrigation water applied at the farm gate, while a life-cycle assessment of the same facility’s full water footprint, including upstream electricity generation, reports a very different figure.
The Solution: How Controlled Environment Agriculture Water Savings Actually Happen
Closed-Loop Recirculation
Recirculating hydroponic systems save water by capturing, filtering, and reusing nutrient solution that would otherwise be discharged. This is the main driver behind large water-savings claims. Grewal et al. (2011), cited in a 2026 Frontiers in Sustainable Food Systems analysis by Izah et al., found that recycling drainage in a hydroponic cucumber greenhouse reduced potable irrigation water by 33% while maintaining typical regional yield. That figure reflects partial recirculation. Full closed-loop systems report higher savings. For deeper reading on recirculating system design, see Recirculating Hydroponic Systems: RDWC, NFT and Ebb and Flow.
Precision Irrigation and Reduced Evaporation and Wind Loss
Open-field lettuce typically absorbs only about 10 to 20% of applied water. The rest is lost to soil-surface evaporation, channel evaporation, runoff, and deep percolation past the root zone. A sealed CEA environment eliminates wind-driven evaporation and delivers water directly to the root zone, so a much larger share of applied water reaches the crop. This mechanism underpins the Barbosa et al. (2015) comparison, which found field lettuce in Yuma, Arizona required roughly 250 liters per kilogram while hydroponic lettuce in the same climate required roughly 20 liters per kilogram.
HVAC Condensate Capture
Plants in sealed environments transpire moisture into the air. HVAC dehumidification removes that moisture and, in systems designed for it, returns the condensate to the irrigation supply. This transfer happens inside the facility boundary and does not create new external water demand. A Yakeclimate vertical-farming engineering guide notes that a defensible water balance tracks crop uptake, atmospheric moisture, condensate recovery, treatment losses, discharge, and outside make-up water separately. Condensate needs treatment before reuse, and its quality varies by system.
Sealed Growing Media
Substrate systems and deep-water culture rafts hold moisture within a defined volume. Open soil exposes a large surface area to evaporation. Containing the growing medium within a sealed or semi-sealed system reduces surface-evaporation loss and supports overall facility water efficiency.
Vertical Farm Water Reuse: How To Build a Closed-Loop System covers the engineering of these mechanisms for operators designing or upgrading their systems.
See How Water Reuse Fits Your Facility
The Crop-Specific Case: Hydroponic vs. Conventional Lettuce Water Use
The most cited direct comparison in the peer-reviewed literature is Barbosa et al., published in the International Journal of Environmental Research and Public Health in 2015. The study modeled conventional field lettuce production in Yuma, Arizona at roughly 250 liters of water per kilogram of harvested lettuce per year. It compared that with hydroponic lettuce production in an 815-square-meter greenhouse in the same climate at roughly 20 liters per kilogram, a reduction of about 92%.
Three methodological caveats frame that figure. First, the comparison covers lettuce in the Yuma, Arizona climate and does not extend to other crops, climates, or system designs without new analysis. Second, the per-kilogram result is normalized against a roughly 11-fold higher modeled yield in the hydroponic case: 41 kg per square meter per year versus 3.9 for field production. The savings figure therefore reflects both reduced water application and higher output per unit area. Third, the hydroponic case carries an approximately 82-fold energy penalty per kilogram, primarily from artificial lighting, as reported in the 2026 Izah et al. analysis in Frontiers in Sustainable Food Systems. Any honest use of the Barbosa result includes both the water savings and the energy difference.
How To Read These Numbers: Measurement Boundaries in CEA Water Savings
Three measurement boundaries appear often in the literature, and each one produces a different headline for the same facility.
Irrigation water applied is the volume withdrawn from a source and delivered to the growing system. It includes conveyance losses and application inefficiencies. This is the widest boundary and usually produces the largest apparent savings versus open-field withdrawals.
Consumptive water use is the fraction of applied water that plants incorporate or lose to evapotranspiration without returning to local waterbodies or groundwater. USGS estimates that approximately 72% of U.S. crop irrigation withdrawals in 2020 were consumptive use. A CEA facility with full recirculation may have low consumptive use relative to applied water, yet the consumptive fraction, what the crop actually transpires, never falls to zero.
Full water footprint extends the boundary upstream to include water consumed in generating the electricity that powers lighting, HVAC, and water treatment. The 2026 Izah et al. analysis notes that facility water use can fall while upstream electricity generation or input manufacture consumes water elsewhere.
Any two CEA water-savings claims can be compared apples-to-apples with five questions. A claim that cannot answer all five is not a defensible number:
-
Is the measurement boundary stated, whether irrigation water applied, consumptive use, or full water footprint?
-
Is the crop named, and is the climate or location specified?
-
Is the field baseline defined, including system, region, and season?
-
Is the recirculation strategy described as full closed-loop, partial recirculation, or drain-to-waste?
-
Is energy intensity disclosed alongside the water figure?
For system-design guidance on greenhouse water recycling, see Greenhouse Water Recycling System: A Complete Guide.
The Trade-Offs Behind CEA Water Savings
CEA’s environmental footprint can exceed that of field agriculture when energy use runs high. A 2026 scoping review of 587 CEA articles in Discover Agriculture notes that multiple studies, including Casey et al. (2022), Kulak et al. (2013), and Theurl et al. (2014), find higher energy and greenhouse gas footprints for crops grown in capital-intensive greenhouses or vertical farms when grids remain fossil-heavy.
Cooling and dehumidification create the largest hidden energy loads. A California Emerging Technologies Coordinating Council project cited in a 2026 industry analysis found that cooling and dehumidification account for roughly 40% of total energy consumption in indoor farms using efficient lighting. During dark periods, almost all cooling work removes water from the air, so the energy cost of condensate recovery must be counted against the water savings it supports.
Water treatment for pathogen and salt management in recirculating systems adds more demand. University of Georgia Extension Bulletin 1595 (2026) notes that UV sterilization, ozonation, and chemical sanitizers can reduce pathogen levels in recirculating CEA systems, yet dosing must be carefully controlled to avoid root phytotoxicity. The same high planting density and recirculating water that improve efficiency also let pathogens spread quickly, and the energy and materials for treatment become real operating inputs.
Water savings always sit alongside energy intensity. A facility on a coal-heavy grid can produce a larger carbon footprint per kilogram of lettuce than conventional field production while still using far less irrigation water. A 2026 Farmingshelter industry overview notes that two identical facilities consuming the same electricity can have very different carbon footprints based only on grid connection.
Those trade-offs define the CEA baseline. Operators then ask whether they can add further water savings without increasing the energy burden. Nanobubble irrigation answers that question as an additive layer.
Adding Savings on Top of the CEA Baseline: Nanobubble Irrigation
Aquadei is the owner of the Gaia technology. Development began in 2008 and produced a platform that infuses precision gases such as oxygen, CO₂, ozone, nitrogen, hydrogen, and others into water as nanobubbles, technically ultrafine bubbles under the ISO fine bubble framework. Gaia now operates as a subsidiary and division of Aquadei, which is why the same technology appears under both names in the literature.
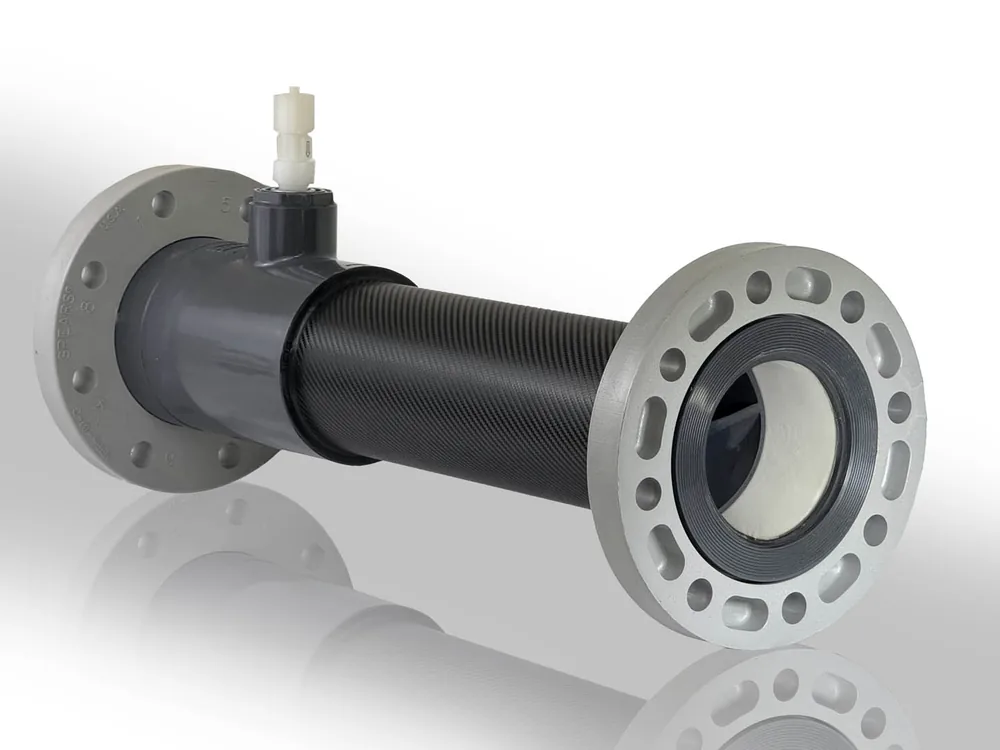
Nanobubble irrigation adds a distinct layer of water savings on top of the CEA baseline. It works alongside closed-loop recirculation, precision delivery, and condensate capture. It changes the physical and chemical properties of the irrigation water itself. Nanobubbles at 100 nanometers or below carry a negative surface charge that prevents coalescence, so dissolved oxygen or CO₂ delivered to the root zone stays in solution for weeks to months rather than seconds.
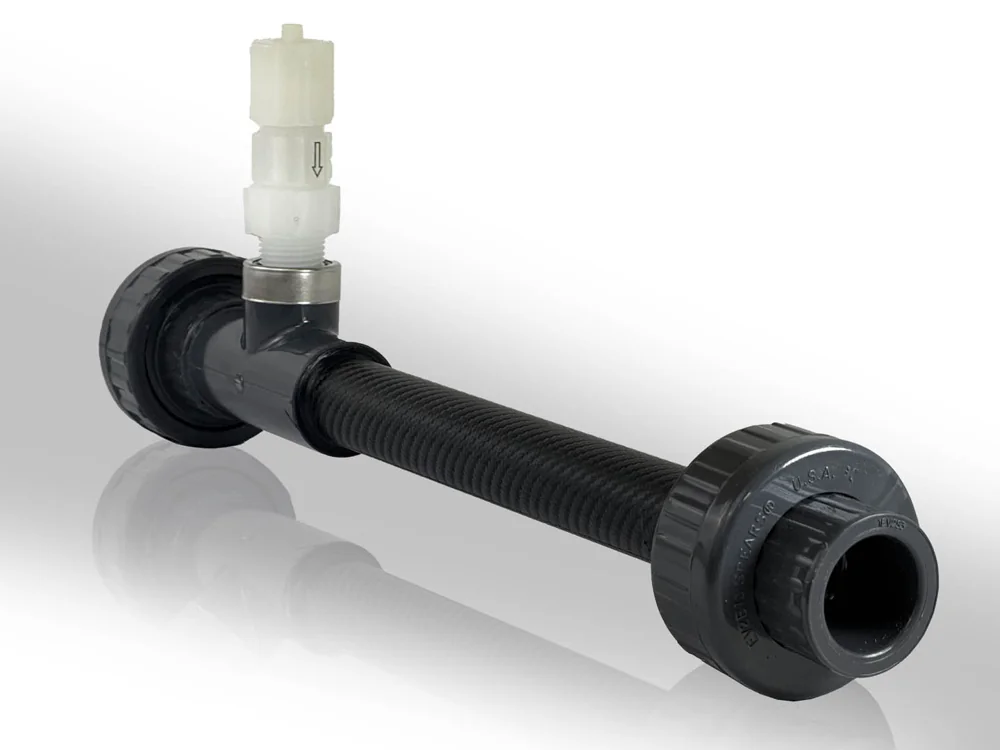
The peer-reviewed evidence for this additive layer comes from Morón-López et al., “Precision nanobubble irrigation tailors plant physiology to drive sustainable lettuce growth with water savings,” Agricultural Water Management, Vol. 325 (2026). The study was led from Arizona State University, with co-authors at the University of Maine and a researcher at NASA Johnson Space Center. It is a multi-institution study and should not be described as solely an ASU study. The generator used in the study was a Gaia UFB-75. The team tested four gases, oxygen, CO₂, nitrogen, and air, at three dilution levels and measured germination, leaf and root development, biomass, and water productivity in lettuce.
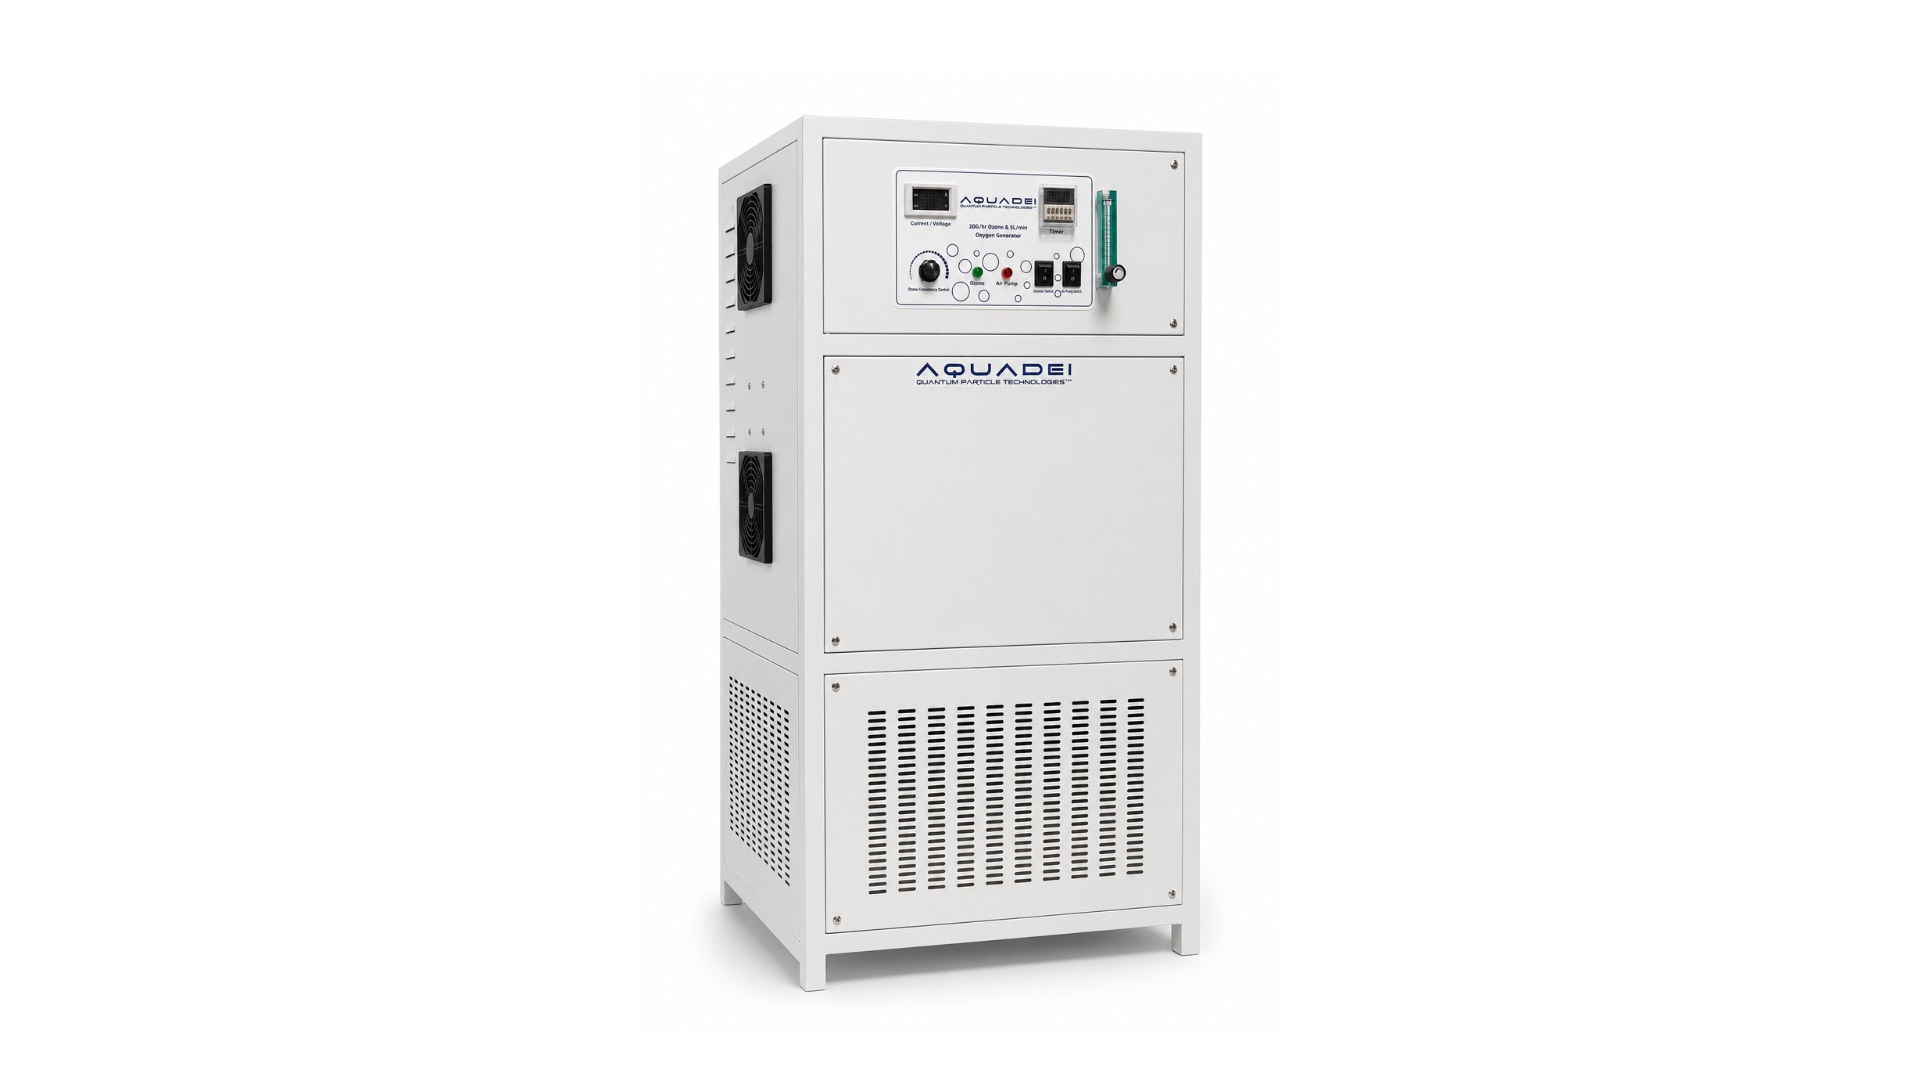
The results show that moderate oxygen nanobubbles enhanced germination, leaf growth, and biomass, with water savings of approximately 23%. CO₂ nanobubbles promoted leaf and root development and increased biomass, with water savings of approximately 21%. These figures apply to the tested lettuce system during germination and early plant development. The study does not extend to full-cycle yield, yield per acre, additional crop cycles, or payback periods. The NASA Johnson Space Center researcher co-authored the paper in an academic capacity, and that role does not represent agency endorsement.
Aquadei’s credentials for this work are specific and documented. Independent confirmation came first. In August 2016, the University of Osaka’s photonics laboratory measured bubbles on the order of 100 nanometers. That measurement places the output well below the ISO fine bubble framework’s ultrafine threshold of 1 micron, which is why the company engineers to that standard, including ISO/TC 281 and ISO 20480-1:2017. The UFB generator has no mechanical moving parts in the flow path, which reduces maintenance risk in continuous irrigation service. Aquadei operates an in-house, PhD-operated characterisation laboratory and holds multiple US patents with grants and filings in Canada, Australia, the EU, India, and Chile. Research collaborations span more than 15 universities and government labs.
Review Nanobubble Options With Aquadei
Frequently Asked Questions
Here are the questions operators and lenders raise most often when they evaluate CEA water-savings figures.
How Much Water Does Controlled Environment Agriculture Save Compared With Open-Field Production?
The range depends on system type, crop, climate, and measurement boundary. Aeroponic systems have been estimated to save up to 95% of water compared with traditional farming. Closed-loop hydroponic systems report roughly 70–95% savings depending on crop and recirculation strategy. Substrate and greenhouse systems with partial recirculation sit lower. The Barbosa et al. (2015) comparison of hydroponic versus field lettuce in Yuma, Arizona found approximately 92% less water per kilogram of output, normalized against an approximately 11-fold higher modeled yield and specific to that crop, climate, and design. No single percentage applies universally.
Why Do Reported CEA Water Savings Percentages Disagree?
The same four variables covered earlier, system type, crop, climate, and measurement boundary, explain most of the divergence. The boundary question usually drives the largest gap. A study that measures withdrawals and a study that measures consumptive use will report different savings for the same facility. USDA ERS sector figures track operation counts and production volume, not liters saved, so they cannot support a universal percentage.
Do the Savings Hold for Substrate Systems as Well as Hydroponic?
Substrate systems save water through reduced evaporation, precision delivery, and recirculation. The magnitude depends on whether drainage is recirculated or discharged. A 2026 review by Aghajanzadeh et al. in Sustainable Energy Technologies and Assessments quantifies closed-loop recirculation savings at 20–40% across CEA technologies, reflecting variation between partial and full recirculation strategies. Substrate systems with drain-to-waste management sit at the lower end, and fully recirculating systems sit higher.
What Is the Energy Trade-Off Behind CEA Water Savings?
The energy-for-water trade-off must appear alongside any water-savings figure. Barbosa et al. (2015) reported that the hydroponic lettuce scenario with 92% water savings carried an approximately 82-fold energy penalty per kilogram versus field production, primarily from artificial lighting. Cooling and dehumidification add further load, with a California Emerging Technologies Coordinating Council project finding roughly 40% of total energy consumption in indoor farms using efficient lighting tied to these functions. Water treatment for pathogen management in recirculating systems, including UV, ozonation, and chemical sanitizers, adds more demand. Overall environmental performance depends on both water savings and grid carbon content.
How Do I Compare Vendor Claims Apples-To-Apples?
Use the five-question checklist above. The two items that most often expose an unscoped claim are the measurement boundary and the disclosed energy intensity. A claim that omits either cannot be compared fairly with one that states them.
Does Nanobubble Irrigation Replace Recirculation?
Nanobubble irrigation does not replace recirculation. It adds a layer on top of the CEA water baseline and works alongside closed-loop recirculation, precision delivery, and condensate capture. The approximately 23% water savings with oxygen nanobubbles and 21% with CO₂ nanobubbles in Morón-López et al. (2026) were measured in a system already operating under controlled conditions. The mechanism changes irrigation water properties and improves root-zone oxygenation and plant physiology, which reduces the volume of water needed to reach the same growth outcomes.
What Is the Evidence Base for Nanobubble Irrigation?
The primary peer-reviewed evidence for water savings comes from Morón-López et al., Agricultural Water Management, Vol. 325 (2026), a multi-institution study using a Gaia UFB-75 generator that reports the water-savings figures cited earlier, alongside improved germination, leaf growth, and biomass in lettuce. The study focuses on germination and early plant development. Supporting mechanistic evidence includes Liu et al. (2019) in the Journal of Cleaner Production, which found micro-nano bubble oxygation increased tomato yield and irrigation water use efficiency by 16.9% in greenhouse trials, and Baram et al. (2021) in the Journal of Cleaner Production, which found oxygen nanobubble aeration increased lettuce aboveground dry biomass by 52% in subsurface drip irrigation trials. Aquadei’s bubble production was independently confirmed at the University of Osaka’s photonics laboratory in August 2016.
Conclusion: Criteria for Any CEA Water-Savings Claim
CEA water savings are real, and the exact number depends on system type, crop, climate, and measurement boundary. A credible figure always comes with a stated boundary, a named crop and climate, a defined baseline, a described recirculation strategy, and disclosed energy intensity.
The 70–90% headline becomes accurate only within a clearly stated scope. Aeroponic systems can reach 95%. Closed-loop hydroponic lettuce in arid climates can approach the Barbosa et al. figure cited earlier, under the same crop, climate, and yield caveats. Substrate systems with partial recirculation sit lower, and all of these figures sit alongside the energy-for-water trade-off that determines the overall environmental footprint.
Aquadei sits as an additive layer on top of that baseline. As the owner of the Gaia technology, Aquadei offers nanobubble irrigation backed by peer-reviewed evidence from Morón-López et al. (2026), which shows additional water savings with oxygen and CO₂ nanobubbles in lettuce. The evidence is specific, scoped, and citable. That standard should guide every CEA water-savings claim.